
Brand Lift studies are designed to help you understand the real impact your ad has had on the people who were exposed to it. The Brand Lift Studies tab is available exclusively for Managed Service users' campaigns. You can access it by clicking on the campaign row from the Campaigns List Page.
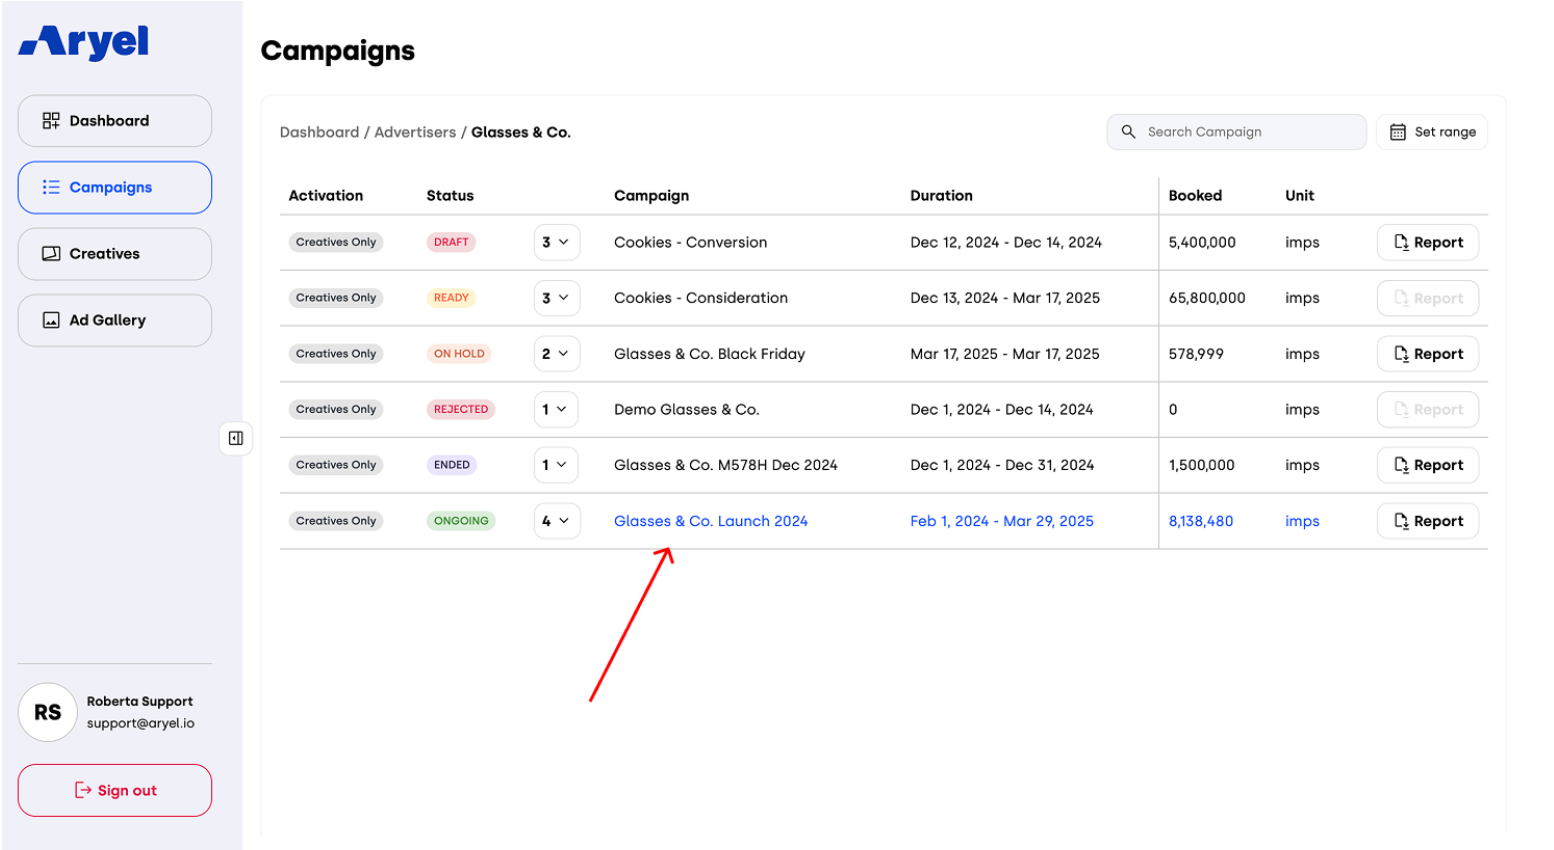
This tab is available only for campaigns that have included the Brand Lift feature as part of their activation.
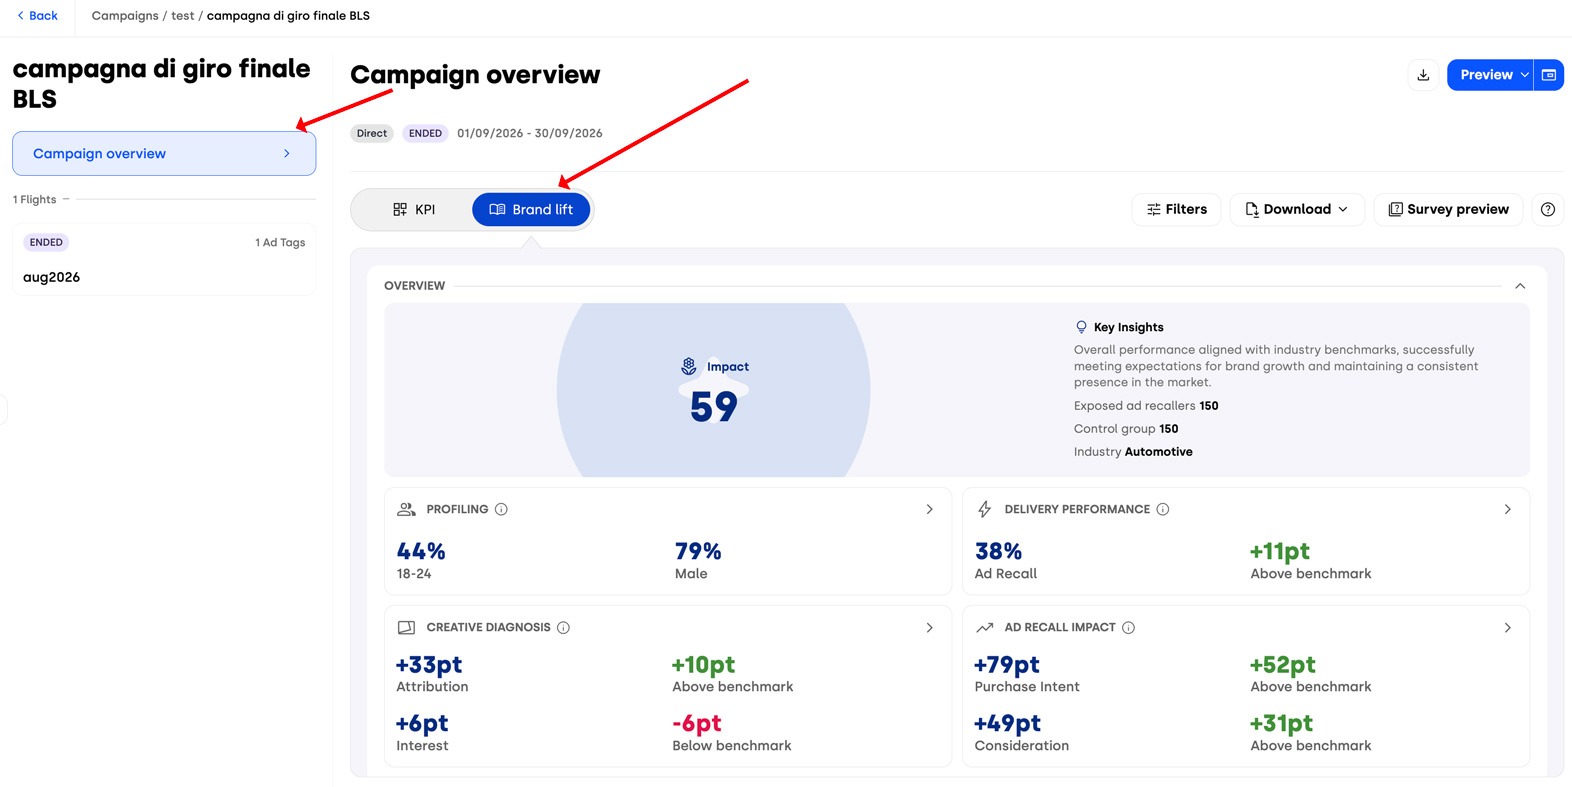
Structure of the Brand Lift Studies Tab
Within the Brand Lift tab, you can access both a preview of the survey and its results. The survey preview is available by clicking the dedicated button.
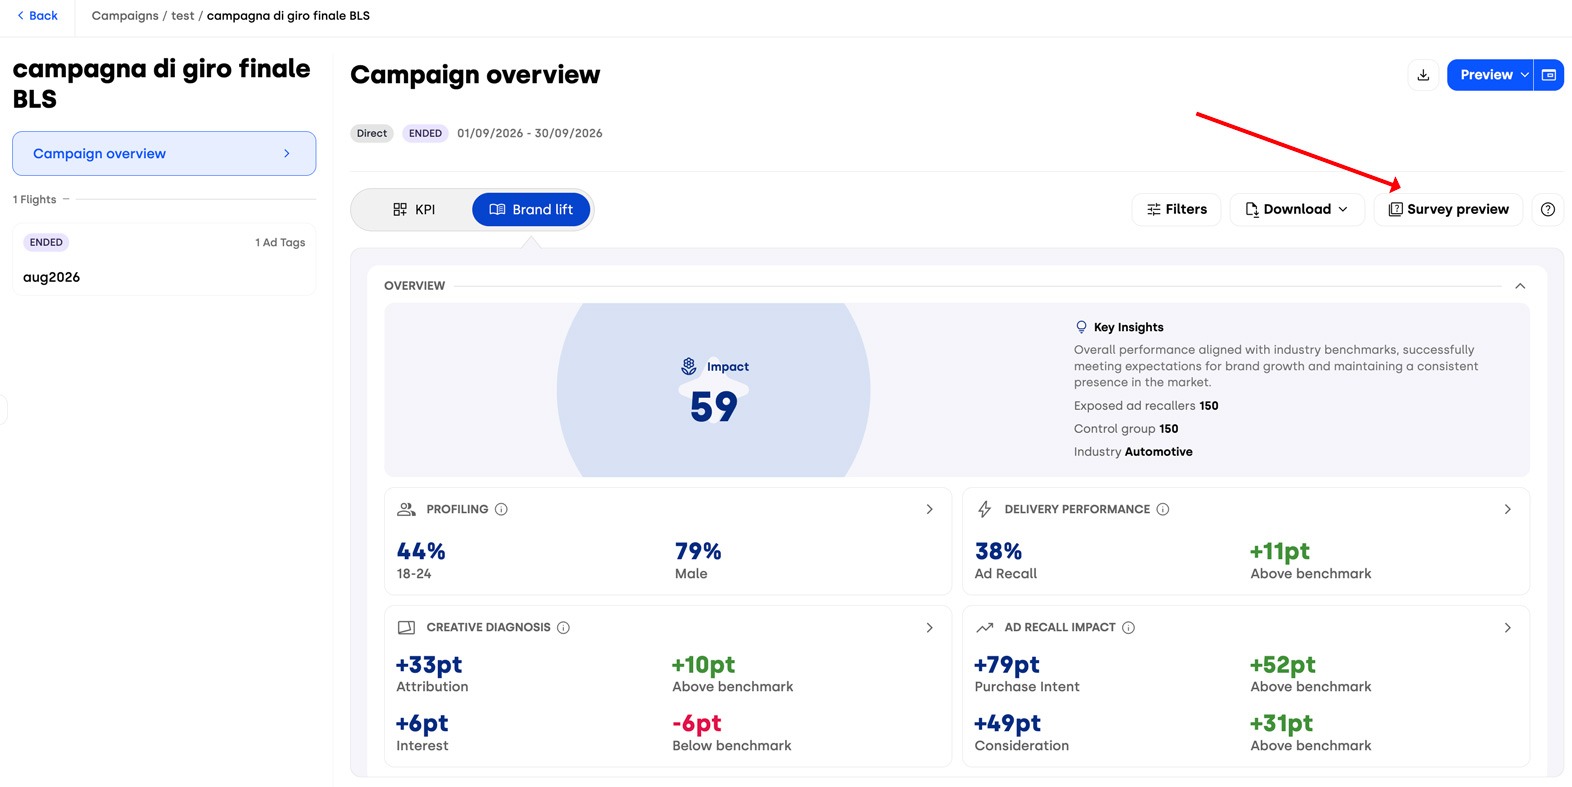
In this view, you can simulate responses to each question, allowing you to review both the questions themselves and the order in which they are presented. The survey preview is accessible even before the study is completed and before the final results are published.

The Brand Lift results are organized into three main sections, each providing a different level of insight: Overview, Audience and Detailed Survey Questions. Methodology information is available in a dedicated panel, and results can be downloaded from the download button.
1. Overview Section
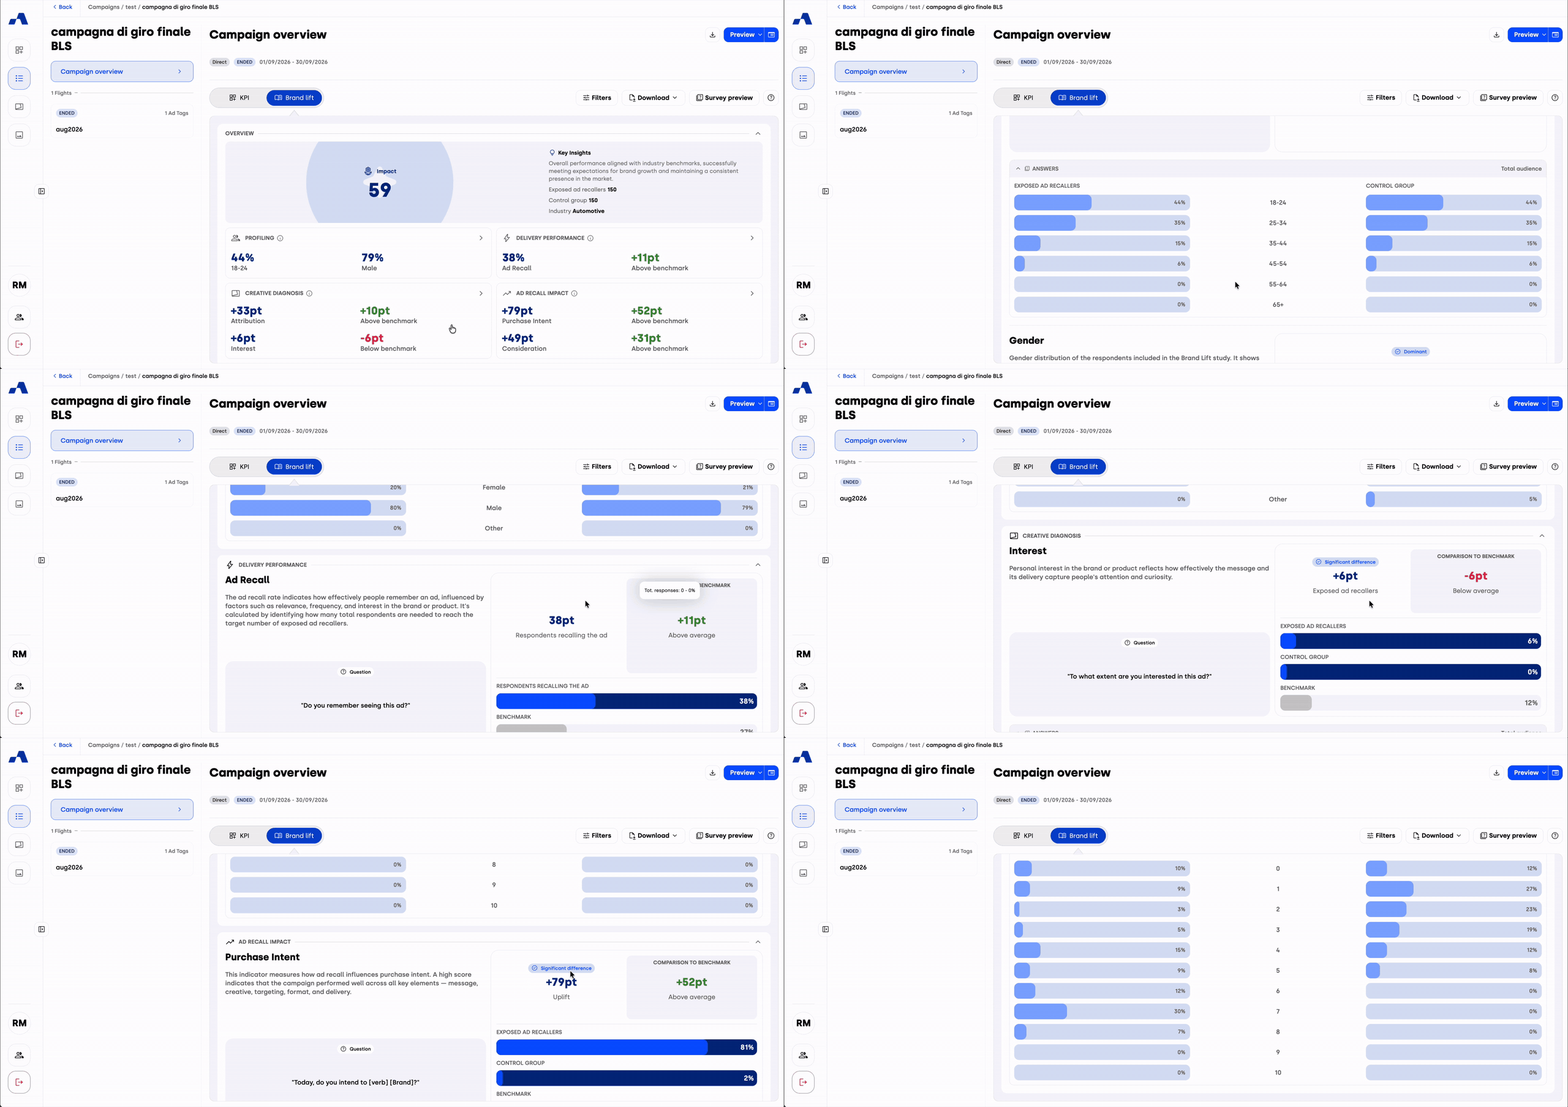
The Overview opens with the study's headline results, followed by a set of blocks, one for each major measurement group.
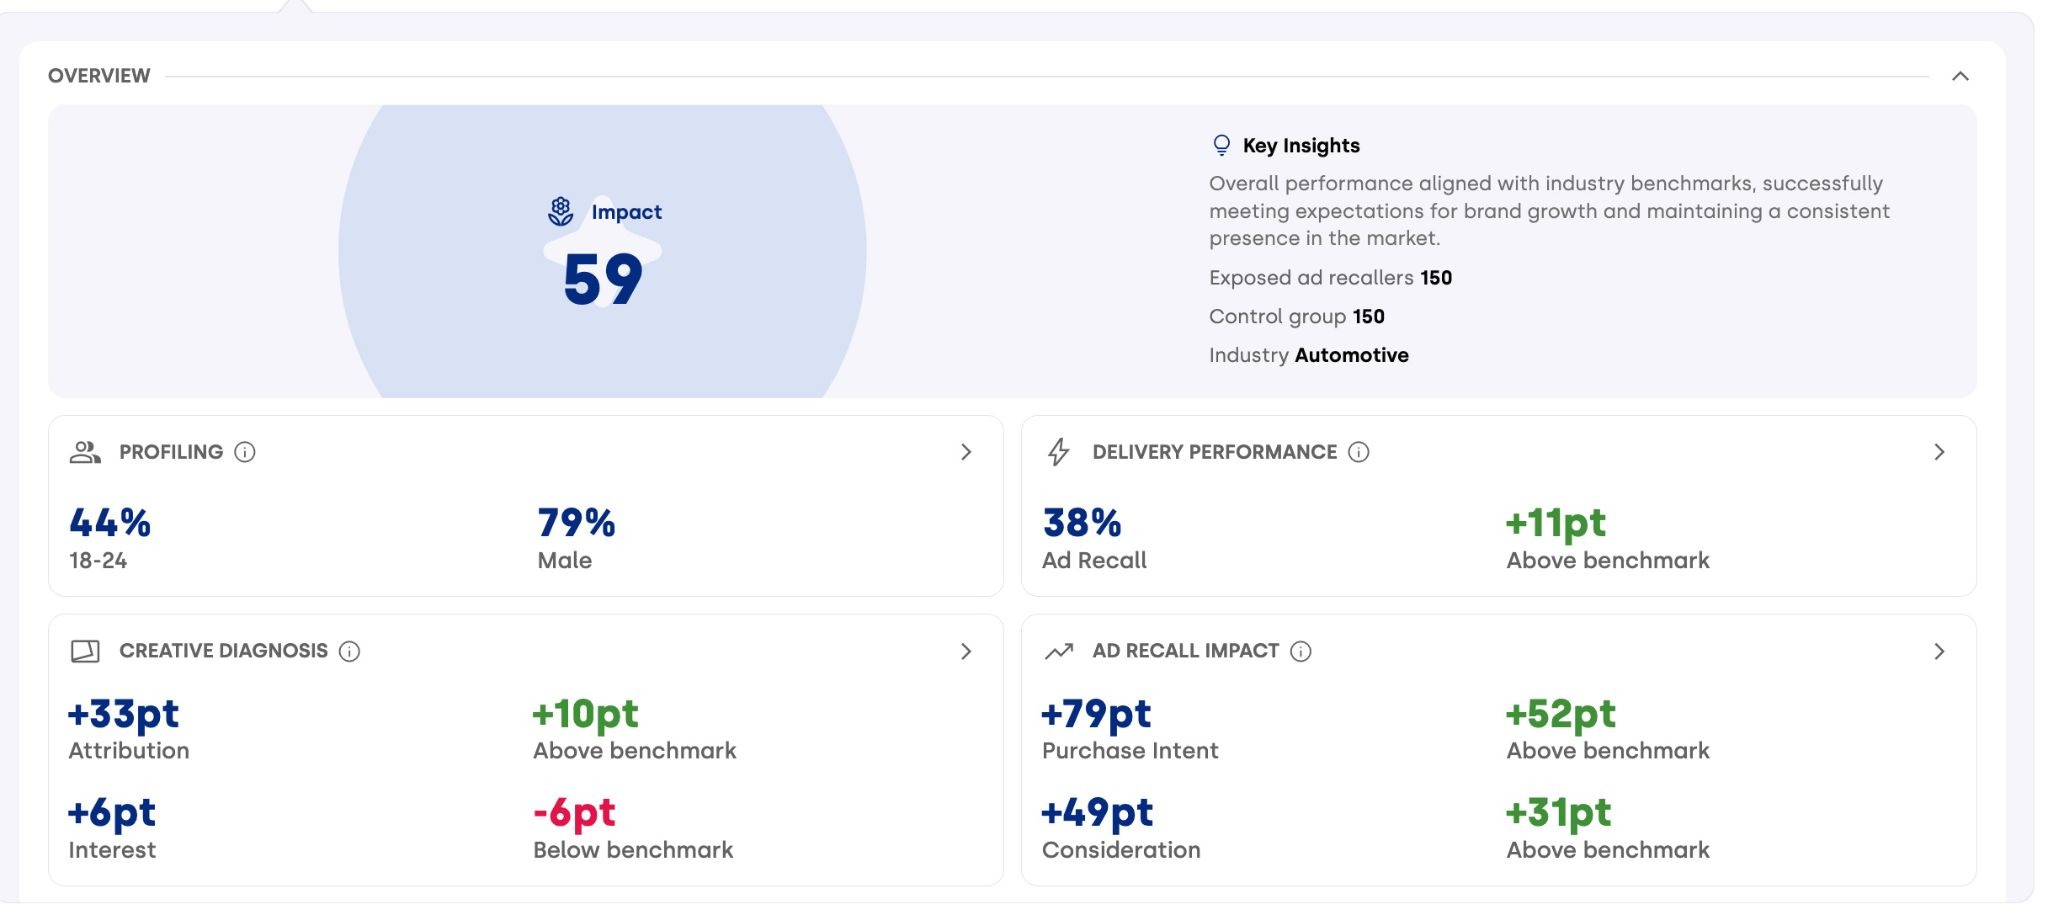
Impact score and Key Insights
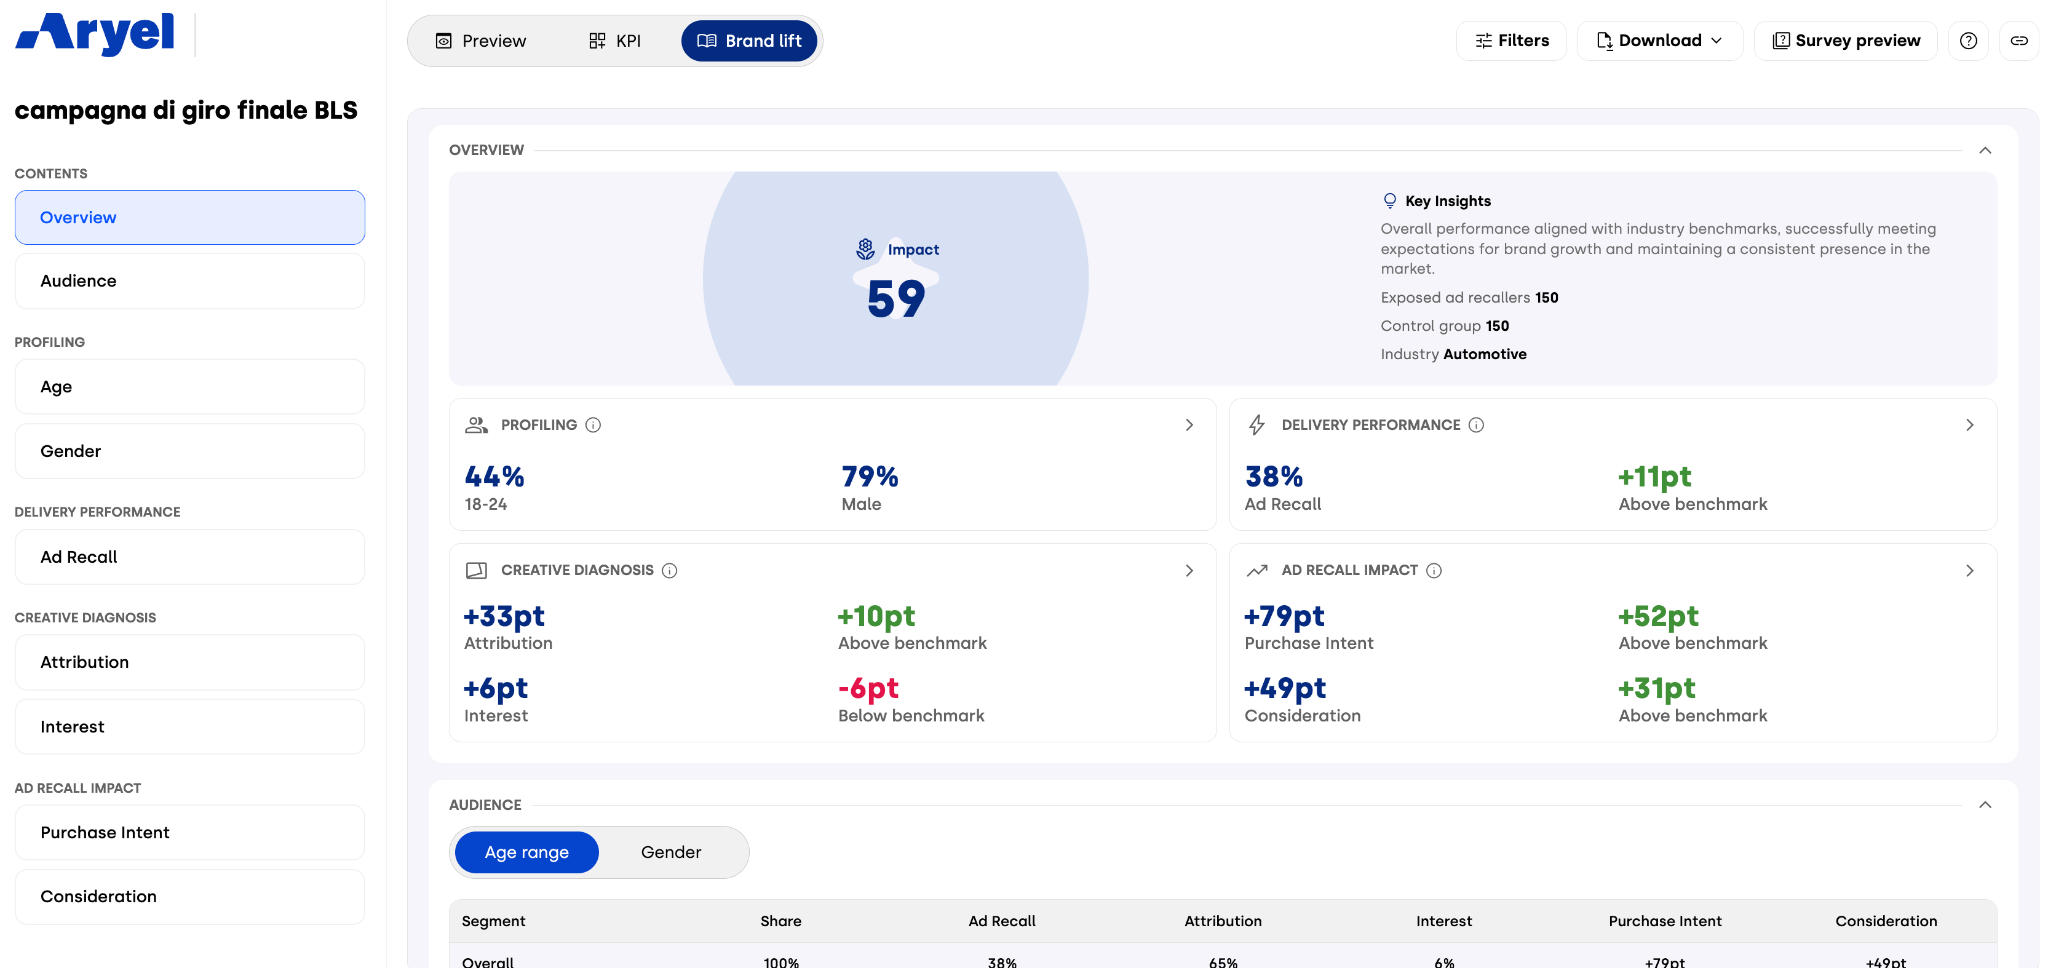
At the top of the section you find the Impact score, a single 0-100 index that summarizes how effective the campaign was overall compared with market benchmarks. Next to it, the Key Insights box offers a short reading of the result, based on the score range, together with the main study details: the number of exposed ad recallers and of control group respondents, and the industry whose benchmarks are used for the comparison.
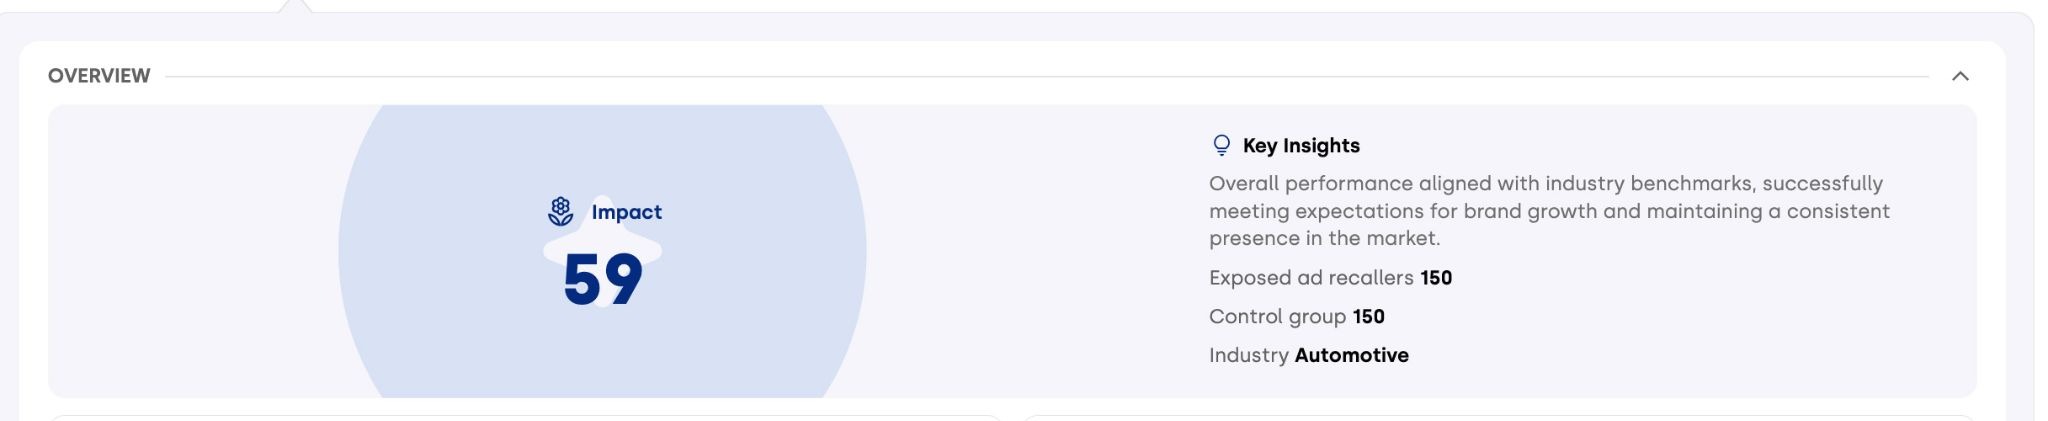
To learn how the score is calculated and how to read each range, see Understanding the Impact Score in Brand Lift Studies.
Measurement blocks
Below, the key KPIs are summarized across the three major measurement groups, plus a Profiling block:
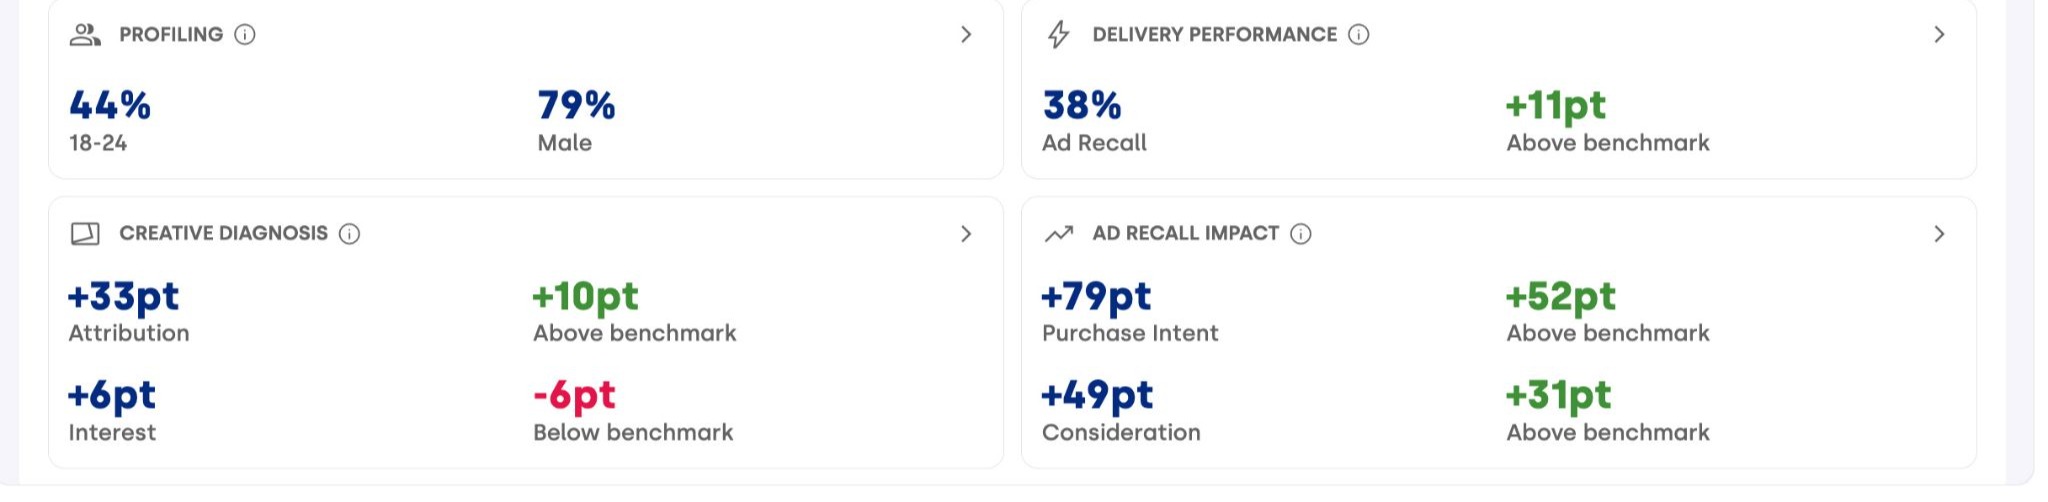
Profiling: the age bracket and the gender with the dominant share in your sample (for example, 44% of respondents aged 18-24 and 79% male), so you can quickly see who answered the survey.
Delivery Performance
Creative Diagnosis
Ad Recall Impact
For the KPIs in these blocks, the value is accompanied by its comparison with the benchmark, shown in points and labeled as above or below benchmark, in green or red respectively.
These KPIs provide an at-a-glance understanding of how your campaign performed in terms of memorability, creative quality, and impact on brand perception.
2. Audience Section
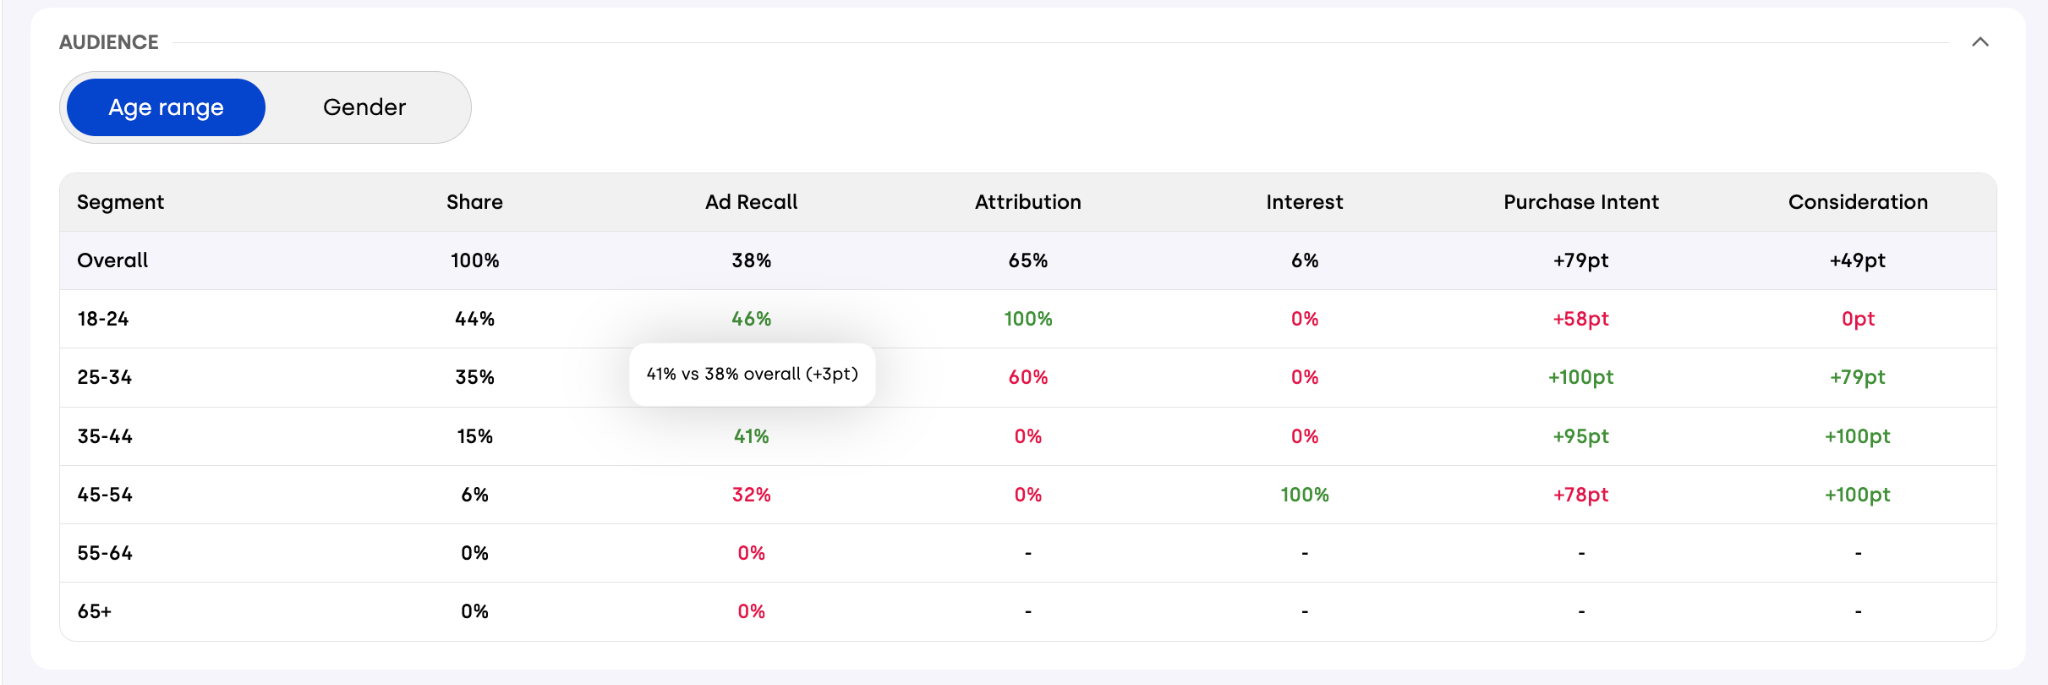
The Audience section gives you a demographic breakdown of the respondents, so you can see not only the overall result of each question, but how it varies across age and gender groups.
It is built around two tables, Age and Gender, which show the results of the Brand Lift questions both as an overall value and for each age bracket (18-34, 35-54, 55+) and gender. Values are displayed as percentages and in points.
Each bracket's value is compared with the overall value and colored green when it is higher or red when it is lower. Hover over any value to open a tooltip with the details of the comparison. For Ad Recall Impact questions, whose result is an uplift, the tooltip shows instead the exposed vs. control group values behind it.
Each table also includes a Share column, showing how respondents are distributed across the different brackets. This helps you understand how much weight each group carries in the sample.
Please note: the Audience section is not available on mobile.
3. Detailed Survey Questions
Here, you can explore each individual question included in the Brand Lift survey, along with the corresponding percentage results for the two respondent groups, compared with the benchmark value:
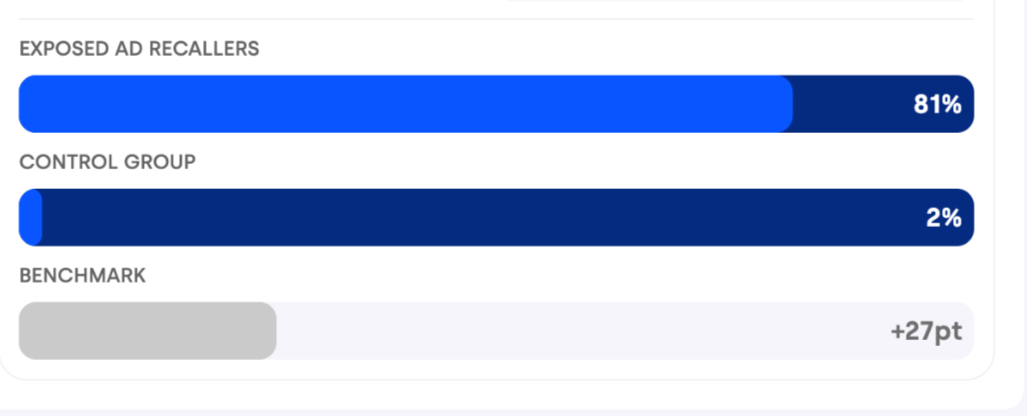
Exposed ad recallers: those who recall seeing the ad.
Control group: those who do not recall seeing the ad.
Benchmark: the market reference value for that KPI.
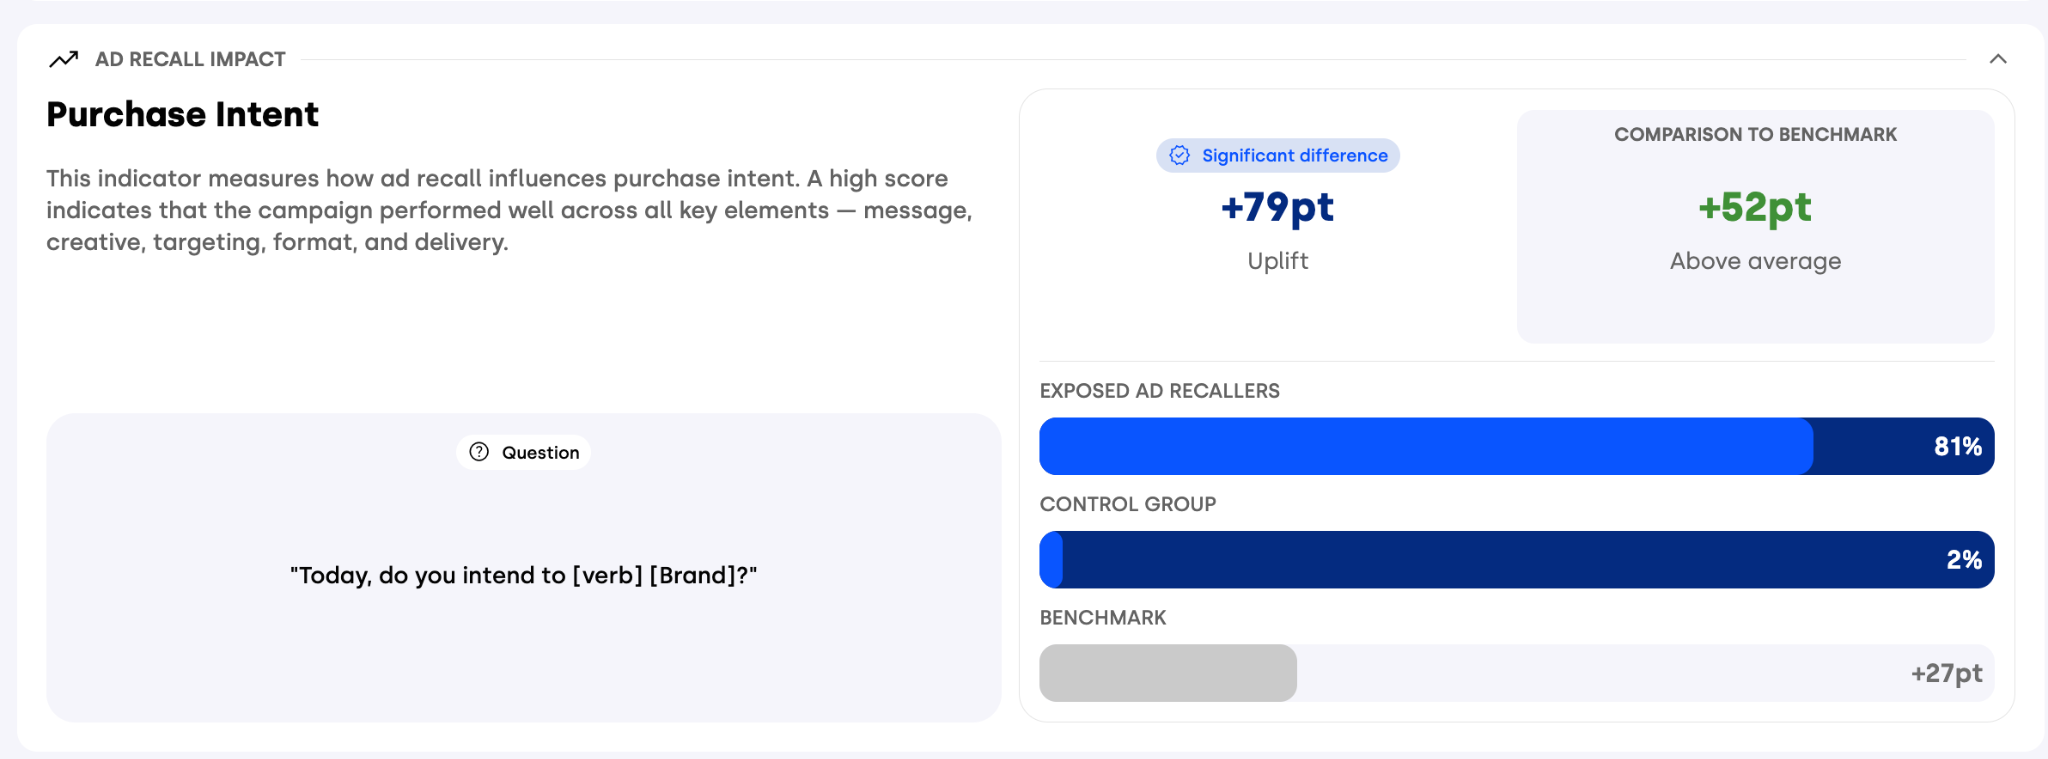
Every question is presented in a structured 5-part block:
KPI Name & Explanation – so you can understand the purpose and objective behind the metric.
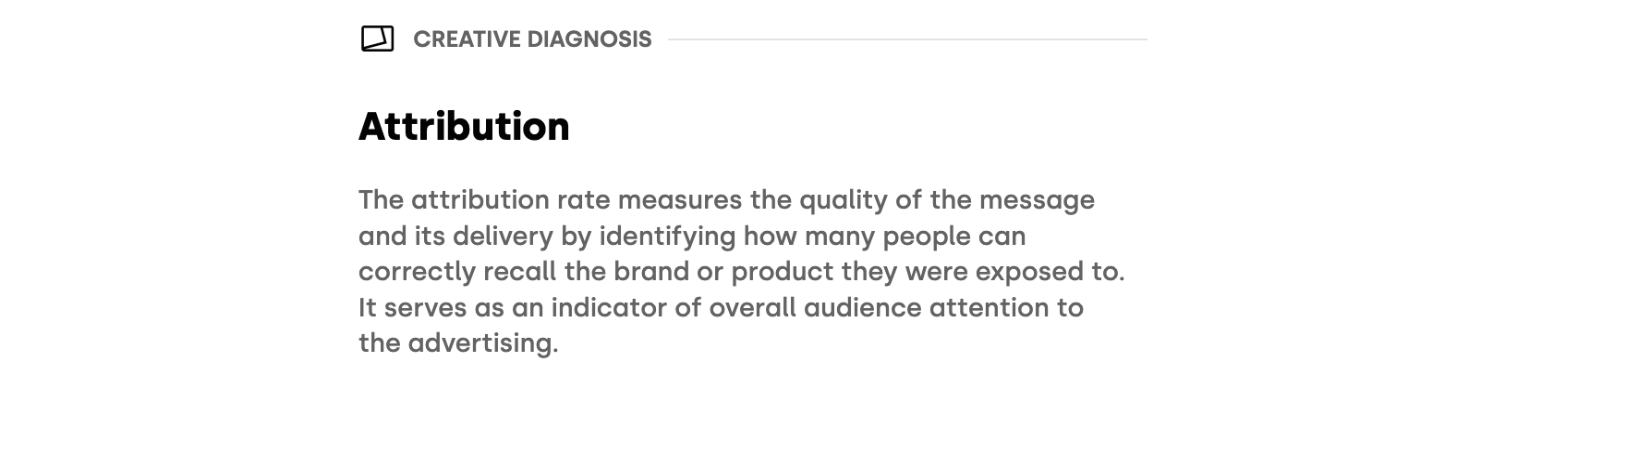
Survey Question – the exact question asked to respondents.

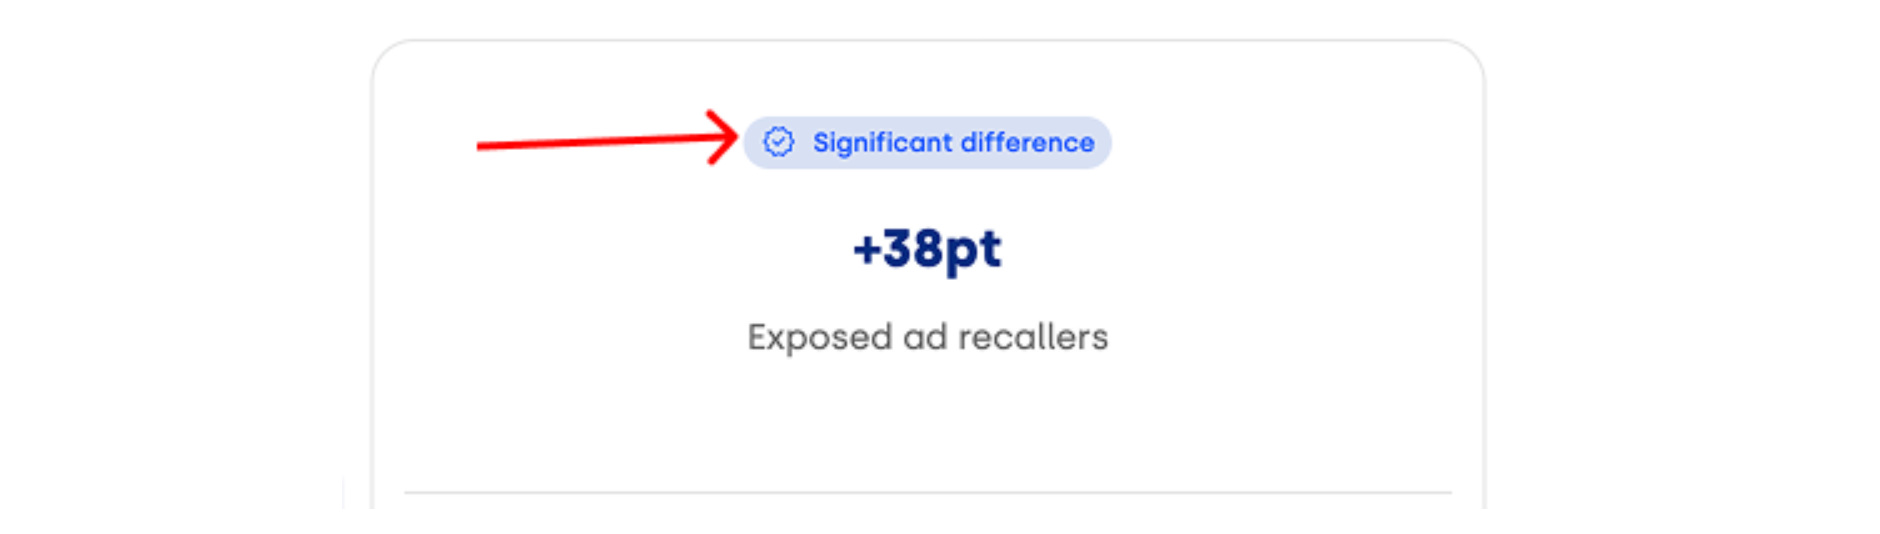
Difference in Score – The point difference between exposed ad recallers and the control group. When this difference is significant, it indicates that the increase or decrease is real and supported by statistical evidence, confirming that the change is not due to chance.
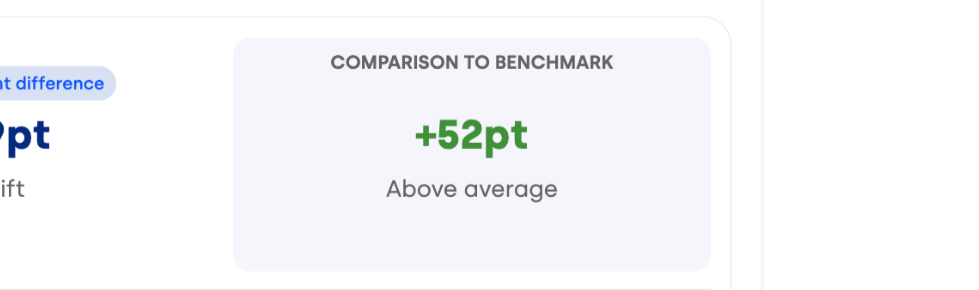
Comparison to Benchmark – how the result compares with the benchmark, in points, labeled as above or below average. For Ad Recall Impact questions, it is calculated by comparing the uplift of your campaign with the benchmark uplift (see Understanding Benchmarks in Brand Lift Studies).
Positive Response Rates – showing the share of affirmative responses from both groups, with the benchmark value displayed below them. For Ad Recall Impact questions, the benchmark is shown in points (e.g. +27pt), as it represents the uplift expected on the market; for all the other questions, it is shown as a percentage.
Show All Answers
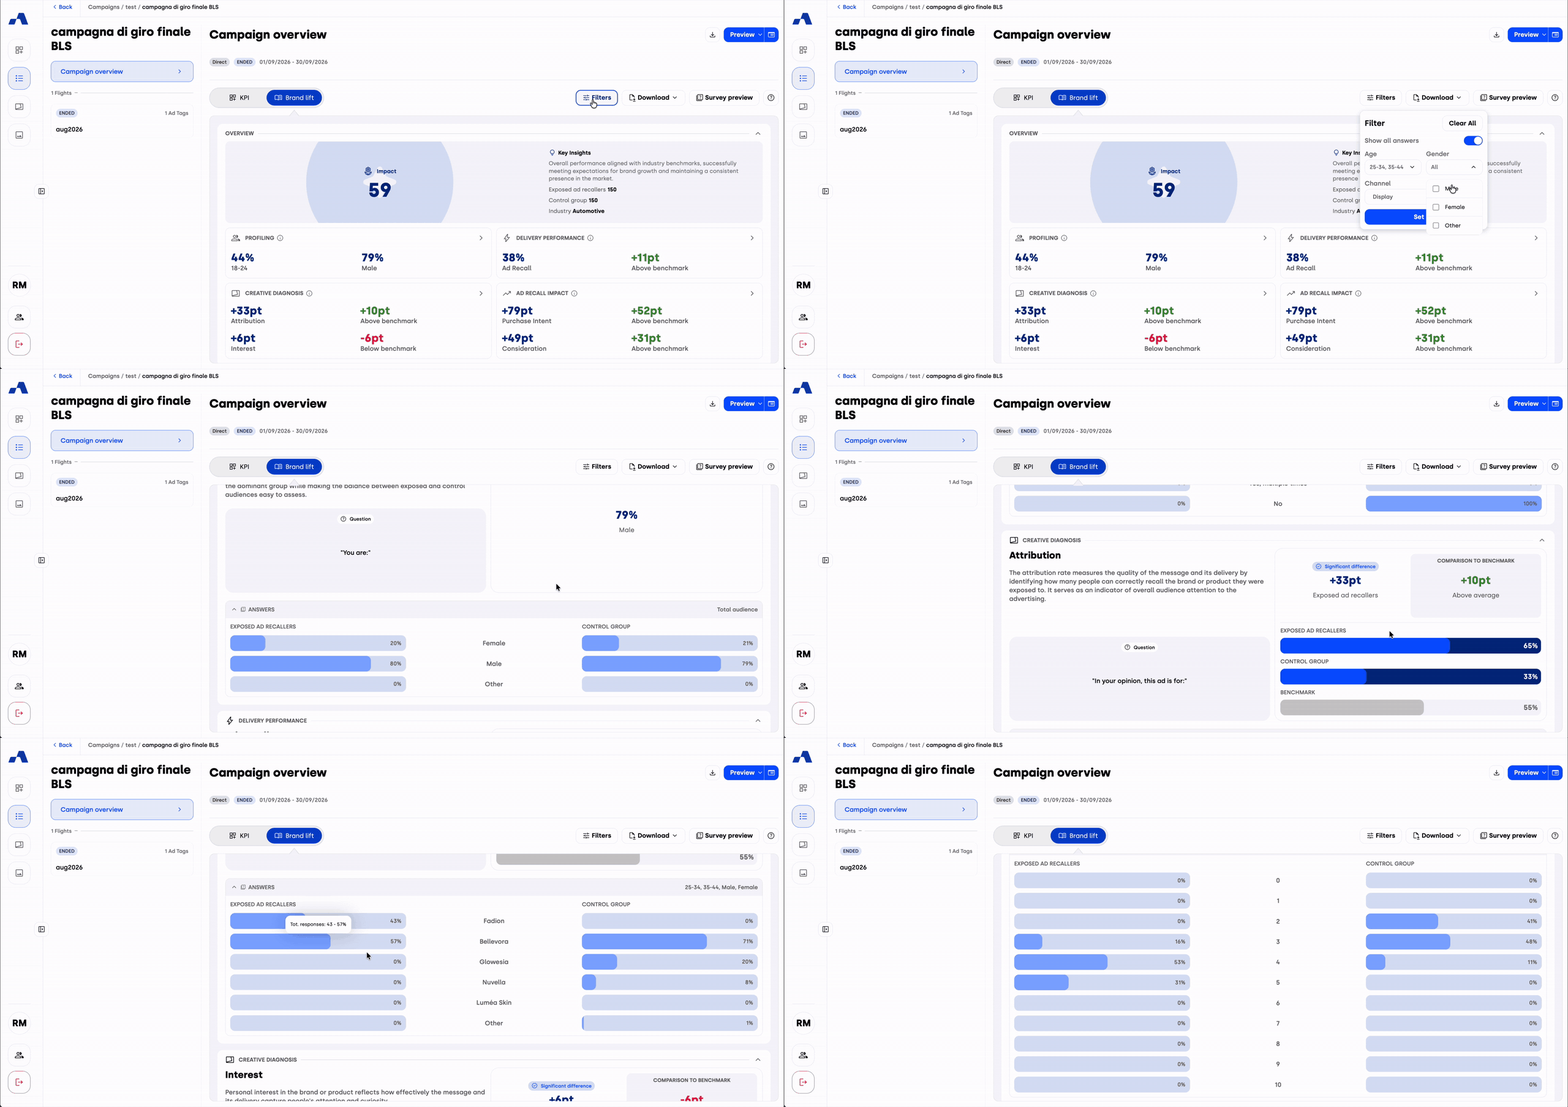
By default, each question shows a summary comparison between the two groups. To see the full response detail behind it, enable the Show all answers switch available for each question.
This opens an Answers panel with the complete breakdown of the responses to that question, split between exposed ad recallers and the control group. Results are displayed as percentages; hover over any value to see the number of respondents behind it.
Instead of a single flat comparison (e.g. 48% vs. 29%), you can explore the full distribution of answers for every question, and see exactly how many respondents sit in each group — a transparent view of the sample behind each result.
Profiling questions
Alongside the KPI questions, the Answers panel also shows the responses to profiling questions — the questions that describe who is in your sample (for example, age bracket or gender). Like the other answers, they are shown as percentages, with the respondent count on hover.
Filtering the answers
With Show all answers enabled, a filters section lets you narrow the Answers blocks down by age bracket (18-34, 35-54, 55+) and gender. If the study is multichannel, you can also select the channel whose results you want to see.
Please note: on mobile, full response details are not filterable.
Methodology Panel
To make room for all the available insights, the methodology information is collected in a dedicated panel, which you can open by clicking the icon in the top-right corner of the tab. The information remains visible on the main page only while the study has no results available yet.
In this panel, you'll find an explanation of what Brand Lift studies are and how the two respondent groups — those exposed to the ad and those unexposed (Control Group) — are formed.
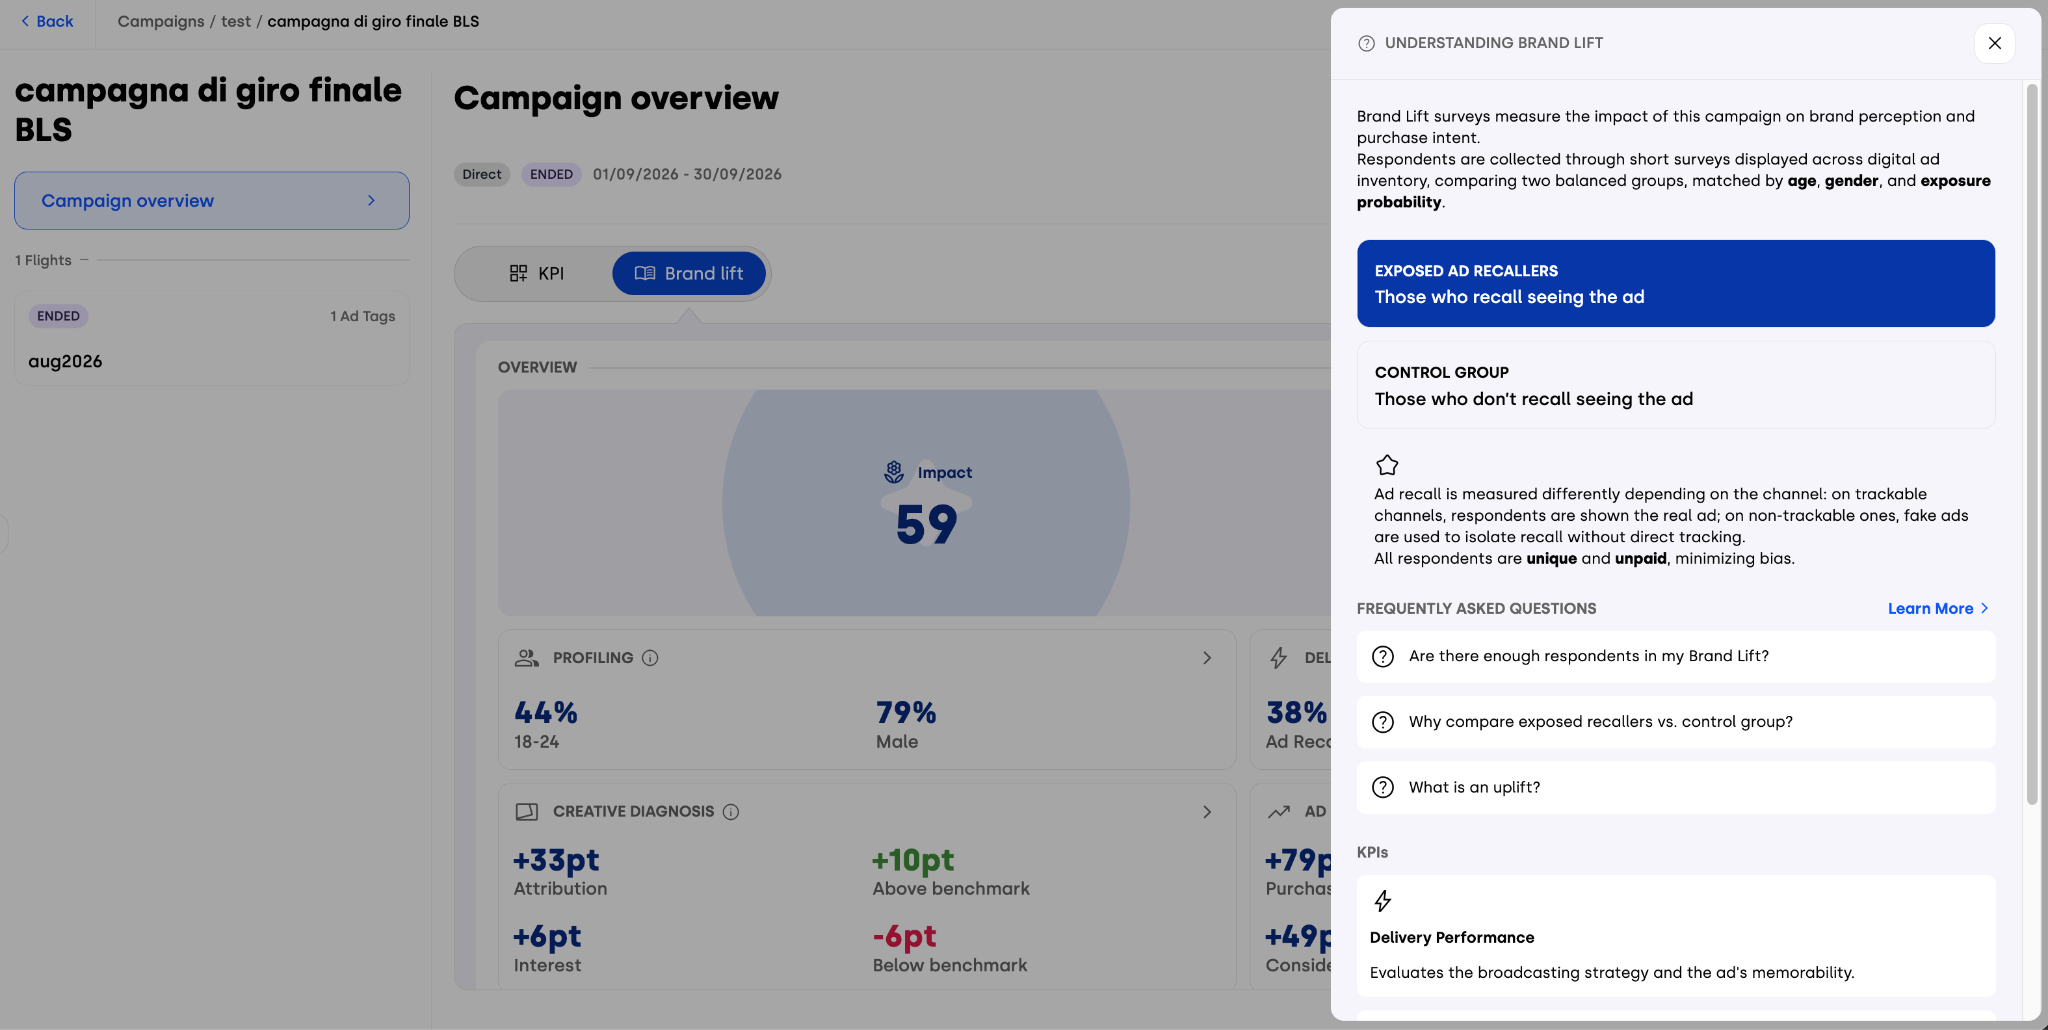
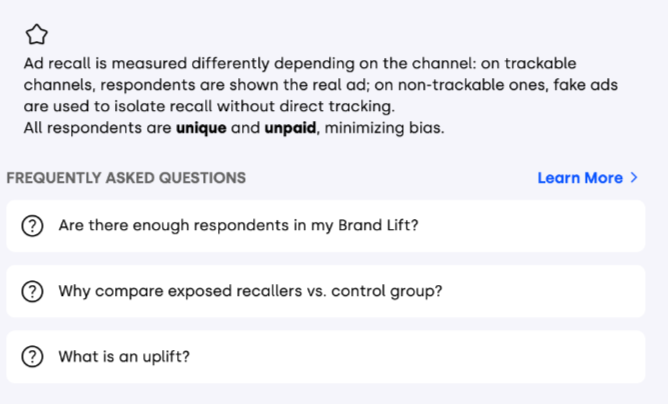
You will also find a FAQs area, including a link to the Help Center for deeper understanding of the Brand Lift studies.
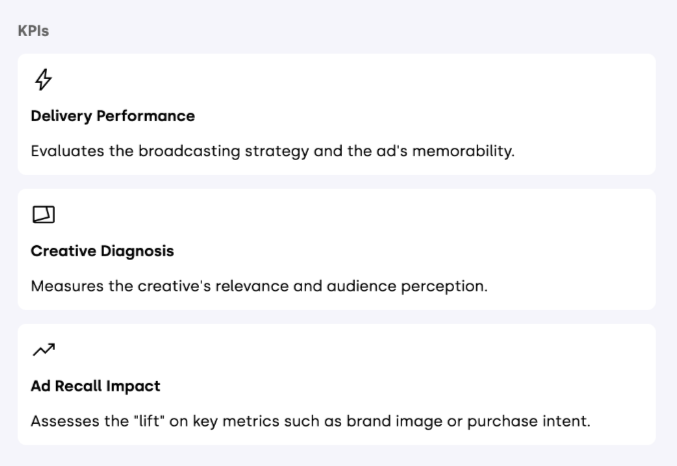
The panel also describes the three macro-groups of KPIs used to evaluate Brand Lift performance:
Delivery Performance: evaluates the broadcasting strategy and the ad's memorability.
Creative Diagnosis: measures the creative's relevance and how it was perceived by the audience.
Ad Recall Impact: assesses the "lift" generated on key metrics such as brand image or purchase intent.
Downloading the Results
From the download button in the Brand Lift Studies tab, you can choose between two options in the dropdown:
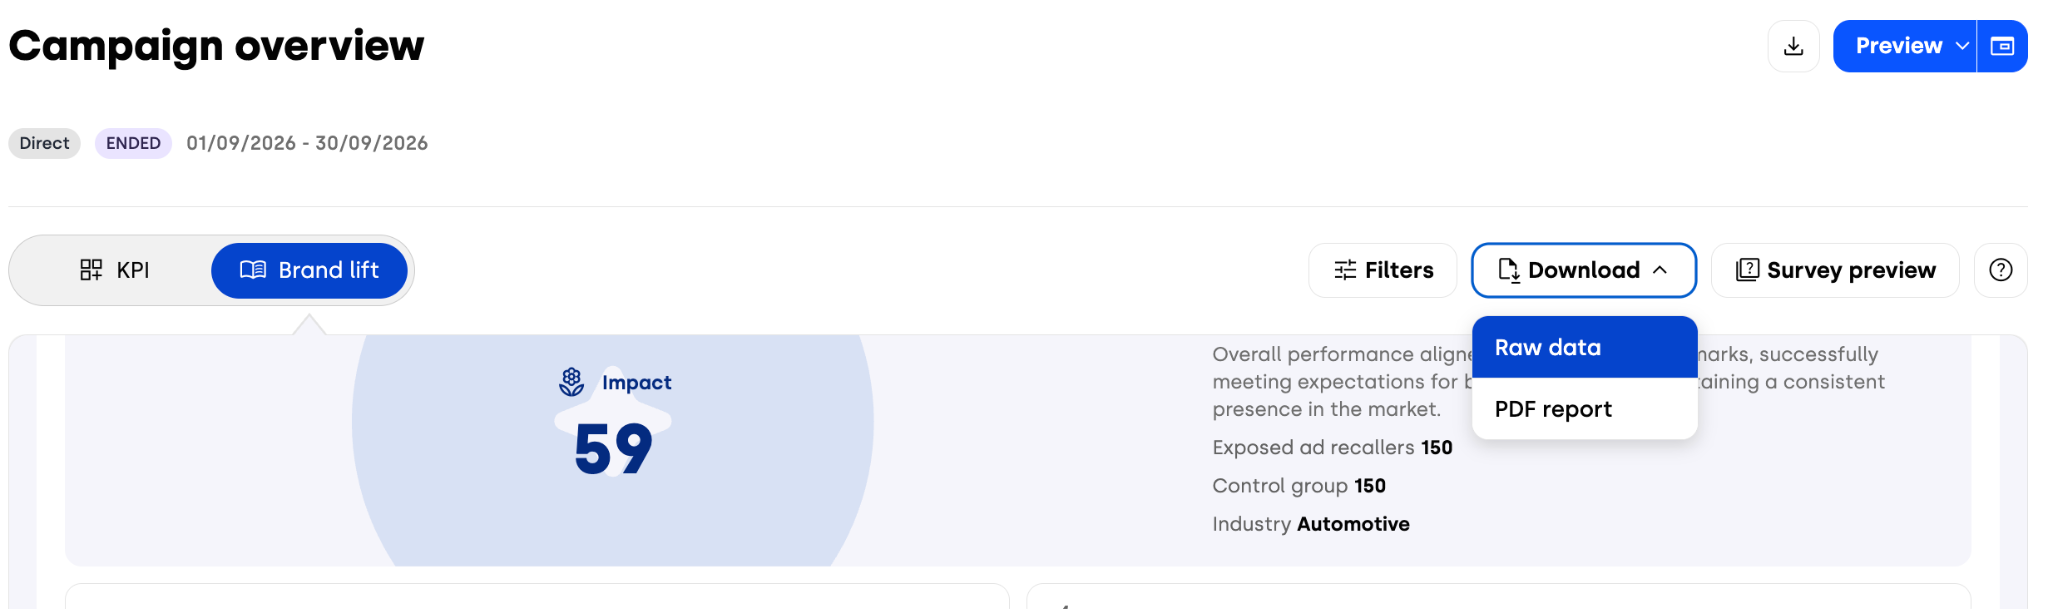
Raw data: the full dataset behind your study, including the overall results, the demographic breakdown shown in the Audience section and the detailed response data for each question. It is available as soon as the study results are ready.
PDF report: the structured Brand Lift Report, with introduction, methodology, overview and KPI details.
For a quick walkthrough of the raw data download, see How Do I Download Brand Lift Raw Data?
Sharing Brand Lift Results with External Stakeholders
In addition to reviewing results directly in Ads Manager, you can also share Brand Lift insights with users who do not have direct access to the platform. From the campaign overview, click the Preview button in the top-right corner and select Insight Mode from the dropdown menu. This action redirects you to an external demo page that is fully shareable and accessible on mobile devices.

To explore the Insights Demo Page in more detail, refer to the dedicated article. When Brand Lift studies are included in the campaign setup, the preview page will also display a Brand Lift section, which mirrors the same structure and visualization available in Ads Manager.
Brand Lift studies enrich your campaign evaluation with new and meaningful insights, allowing you to clearly understand how your ad influenced your audience — whether in terms of perception, intent, interest, or overall brand resonance.
By integrating these findings into your analysis, you gain a more complete, data-backed view of your campaign’s real-world effectiveness.