When your campaign is ongoing and you need to share both KPI performance and creative visualization with clients or stakeholders, the Insights-Demo Page provides a unified, accessible way to do so. The Insights-Demo Page is only available when the flight is in an ongoing, on hold, or ended status.
To get started, go to the Campaigns List and click the row of the campaign you want to review.
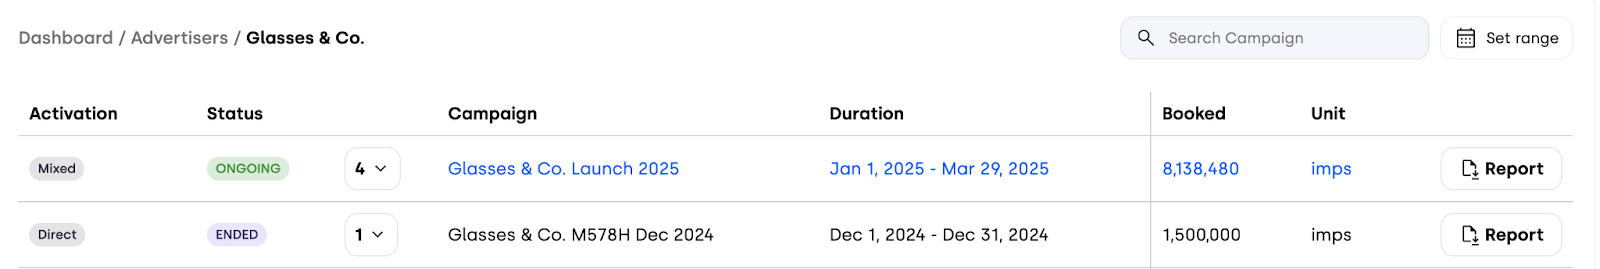
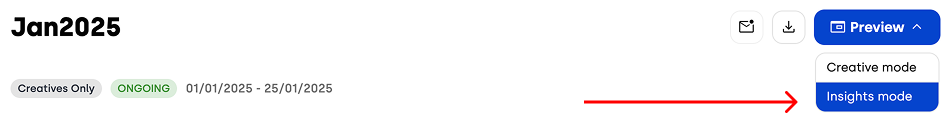
This will take you to the Campaign Overview Page. In the top-right corner, click the Preview button: a dropdown menu will appear. Select Insights mode to open the Insights-Demo Page.
This page can be shared with individuals who do not have access to the Ads Manager account, and it is also fully accessible from mobile devices.
The Insights-Demo Page is divided into two main sections, accessible via a toggle at the top center of the page:
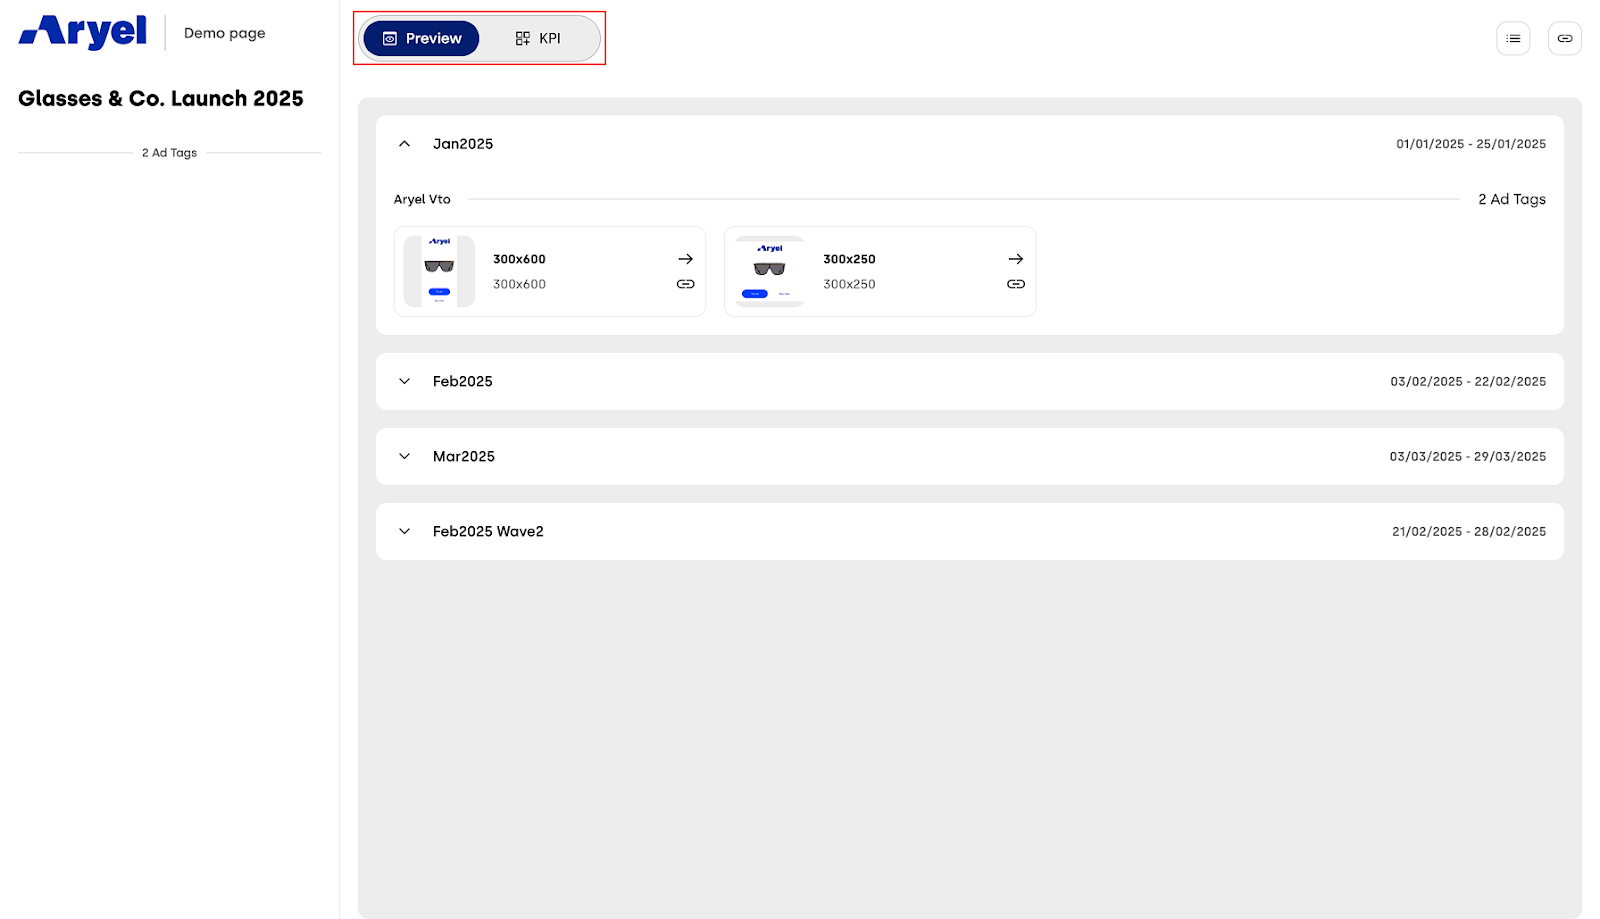
1. Preview Section
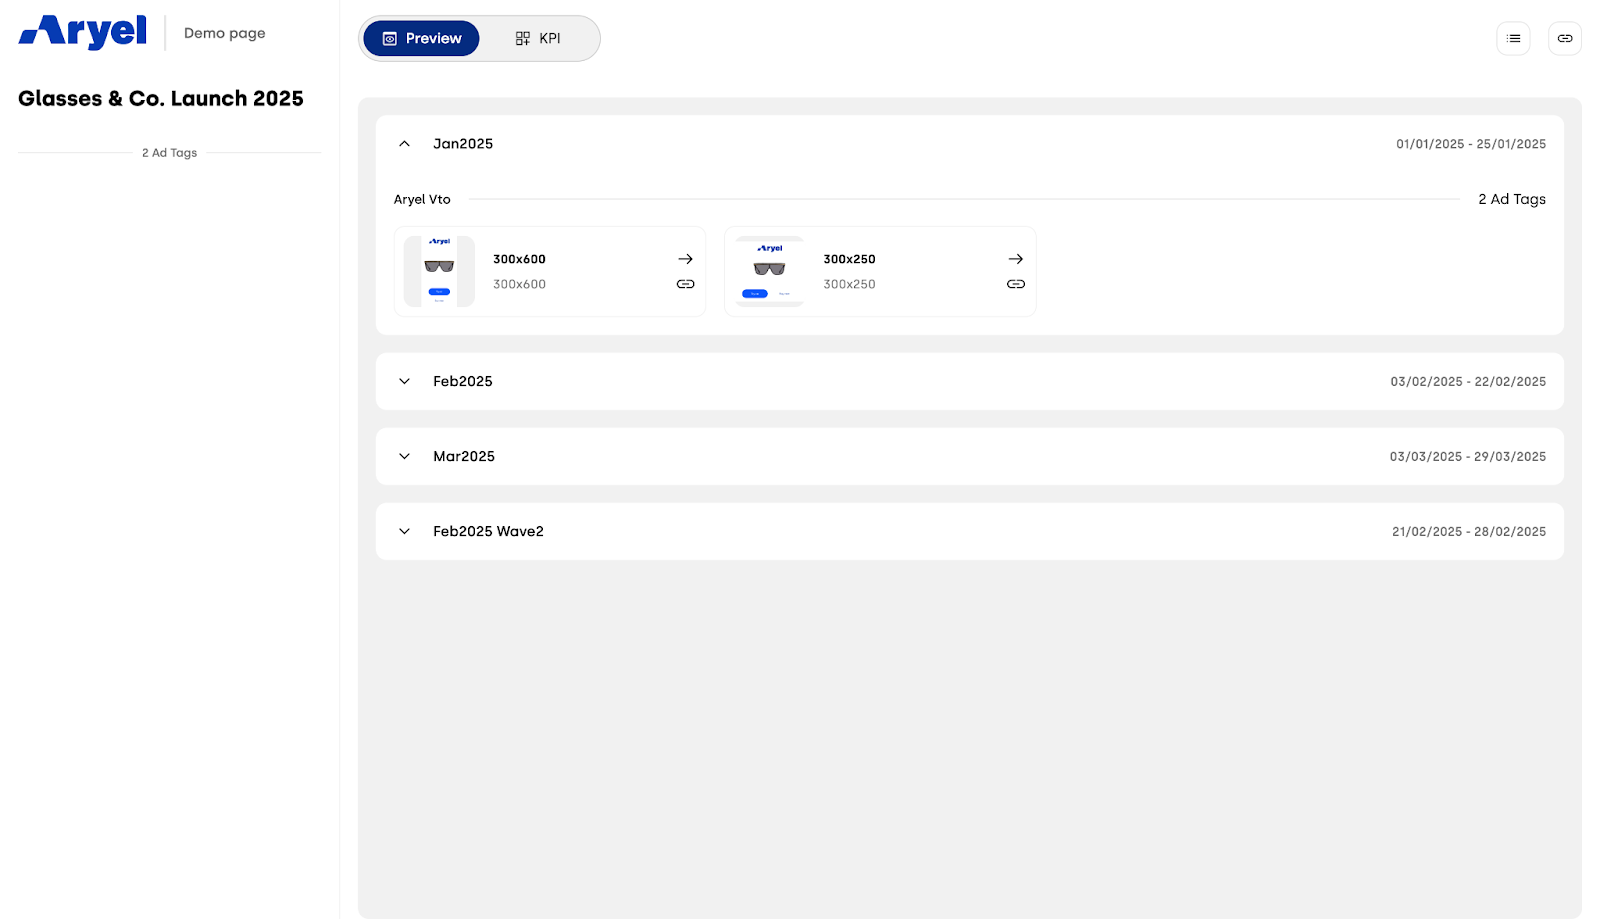
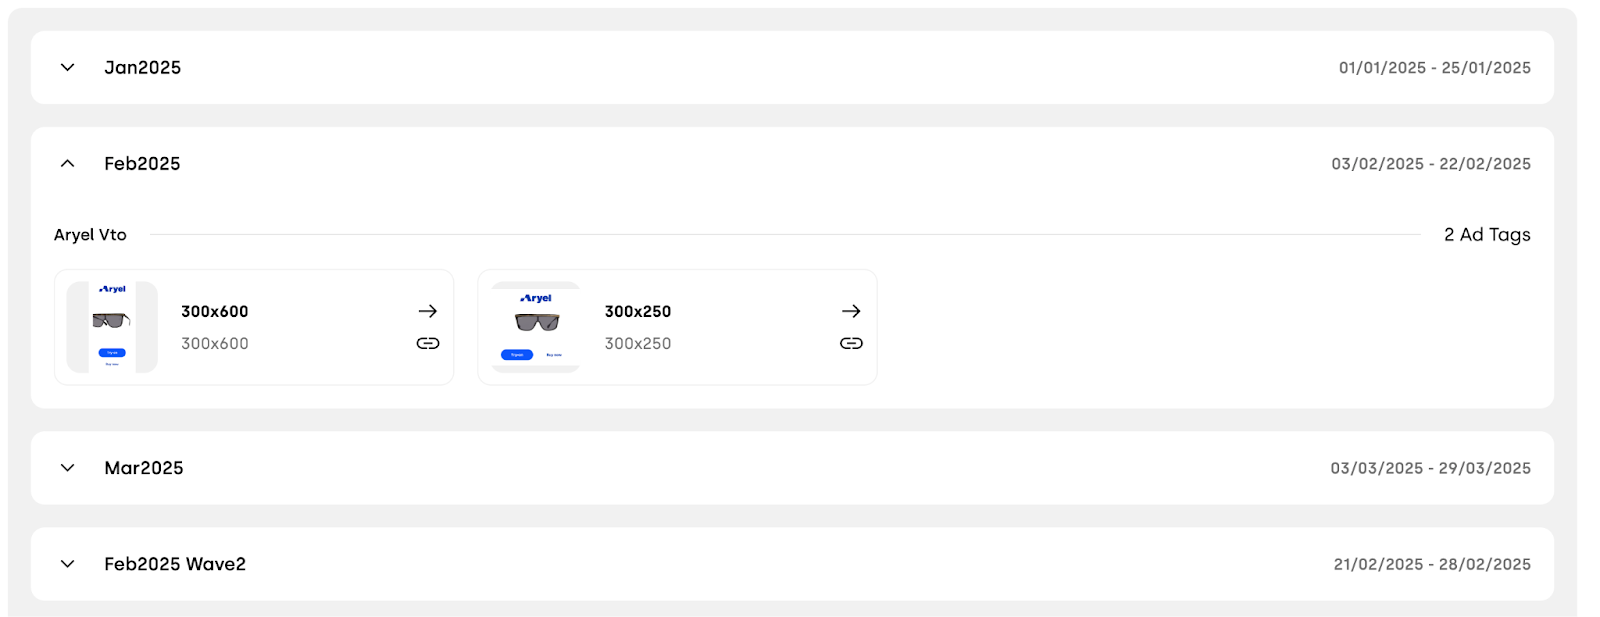
The Preview Section is organized by flight. For each flight, you will see a row containing a card for every ad tag included in that flight.
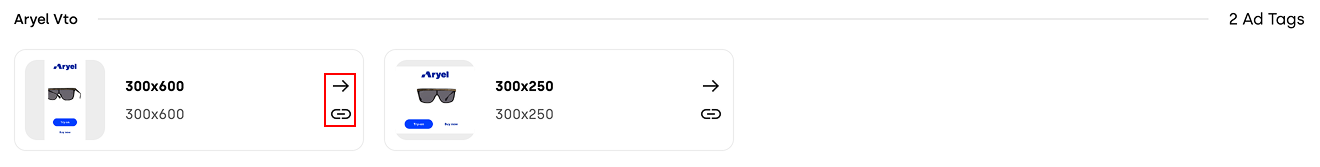
On each card, you can perform two main actions: you can copy the link of the single tag preview to share it quickly with others, or you can open the dedicated preview area by clicking the arrow to explore how that specific asset looks and behaves.
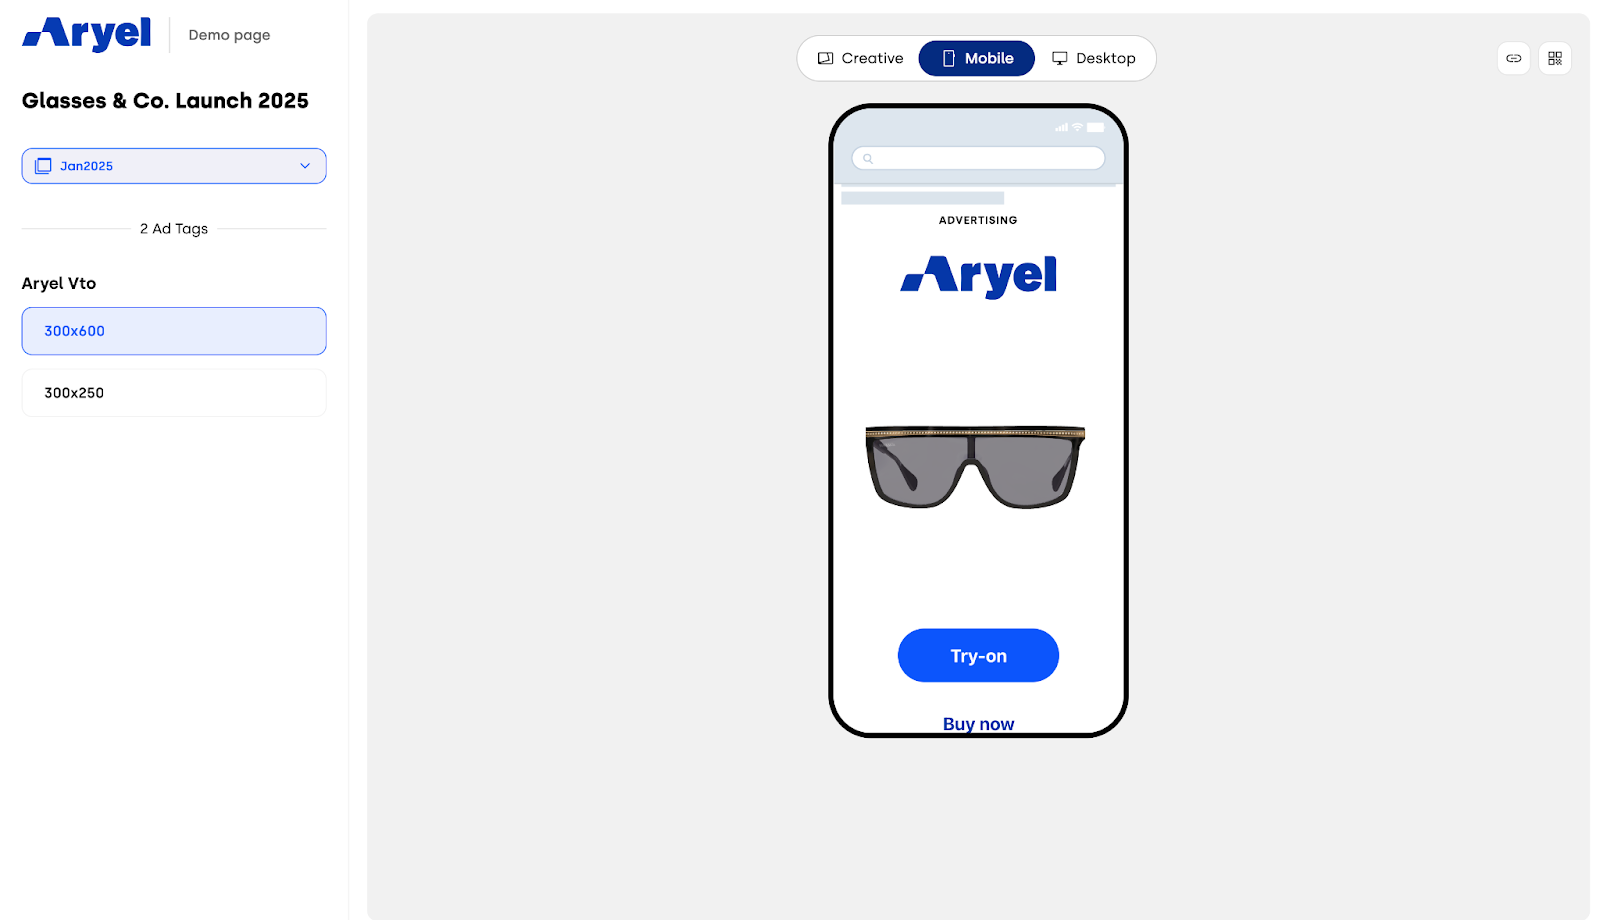
When you open the ad tag preview, the page is split into two main areas. On the left, a panel lists all the ad tags associated with the selected flight, allowing you to move from one tag to another without leaving the page. A dropdown menu is also available, enabling you to switch between different flights without exiting the ad tag preview area. On the right, you find the preview area, where a demo version of the selected ad is displayed so you can visually validate layout, assets, and interactions.
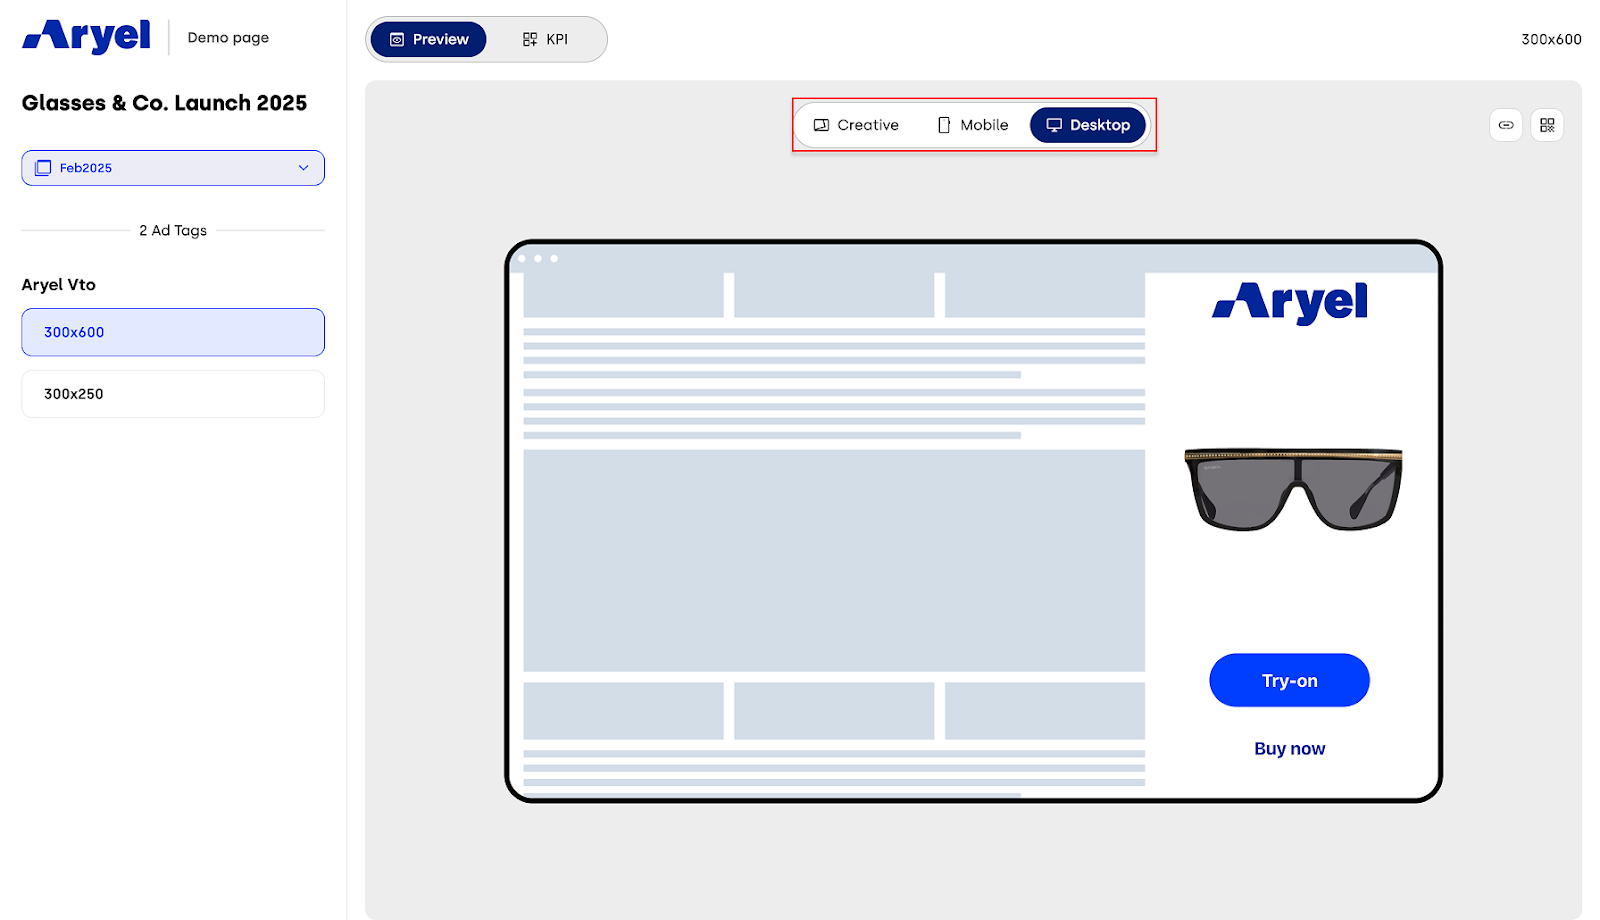
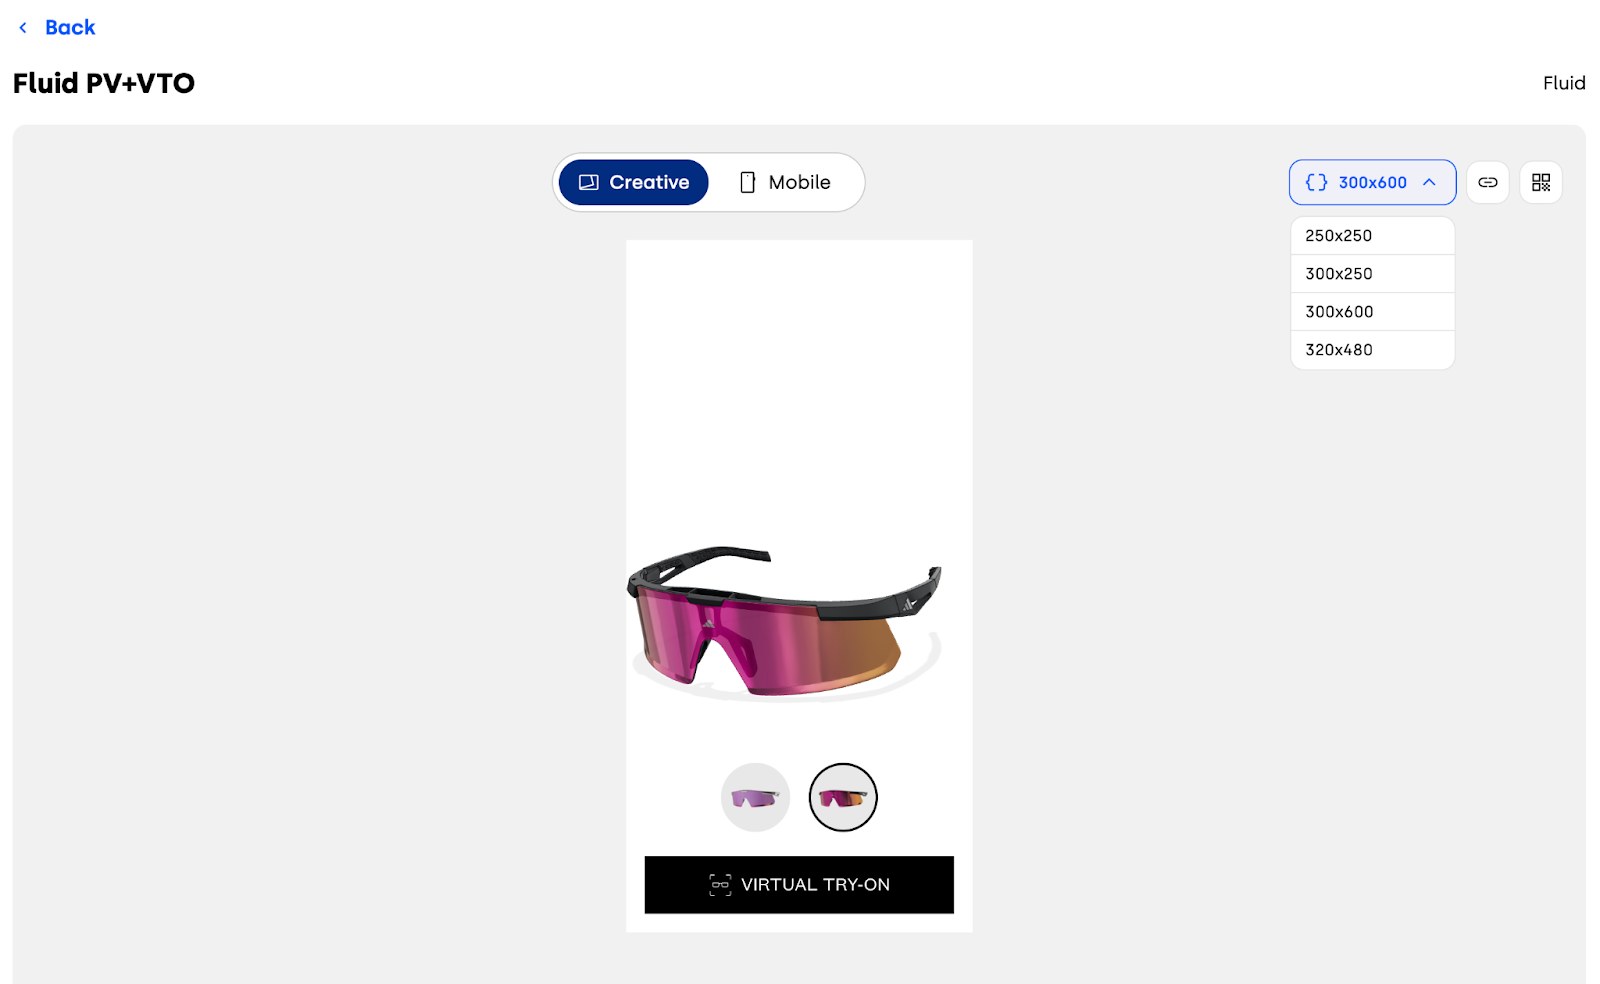
Depending on how the creative has been set up, you may also see additional controls. A dedicated toggle lets you switch between only creative, mobile and desktop layouts, so you can immediately understand how the banner will appear on different devices.
If the output is an iframe, a size selector in the preview menu allows you to test different dimensions and verify how the creative adapts across multiple formats.
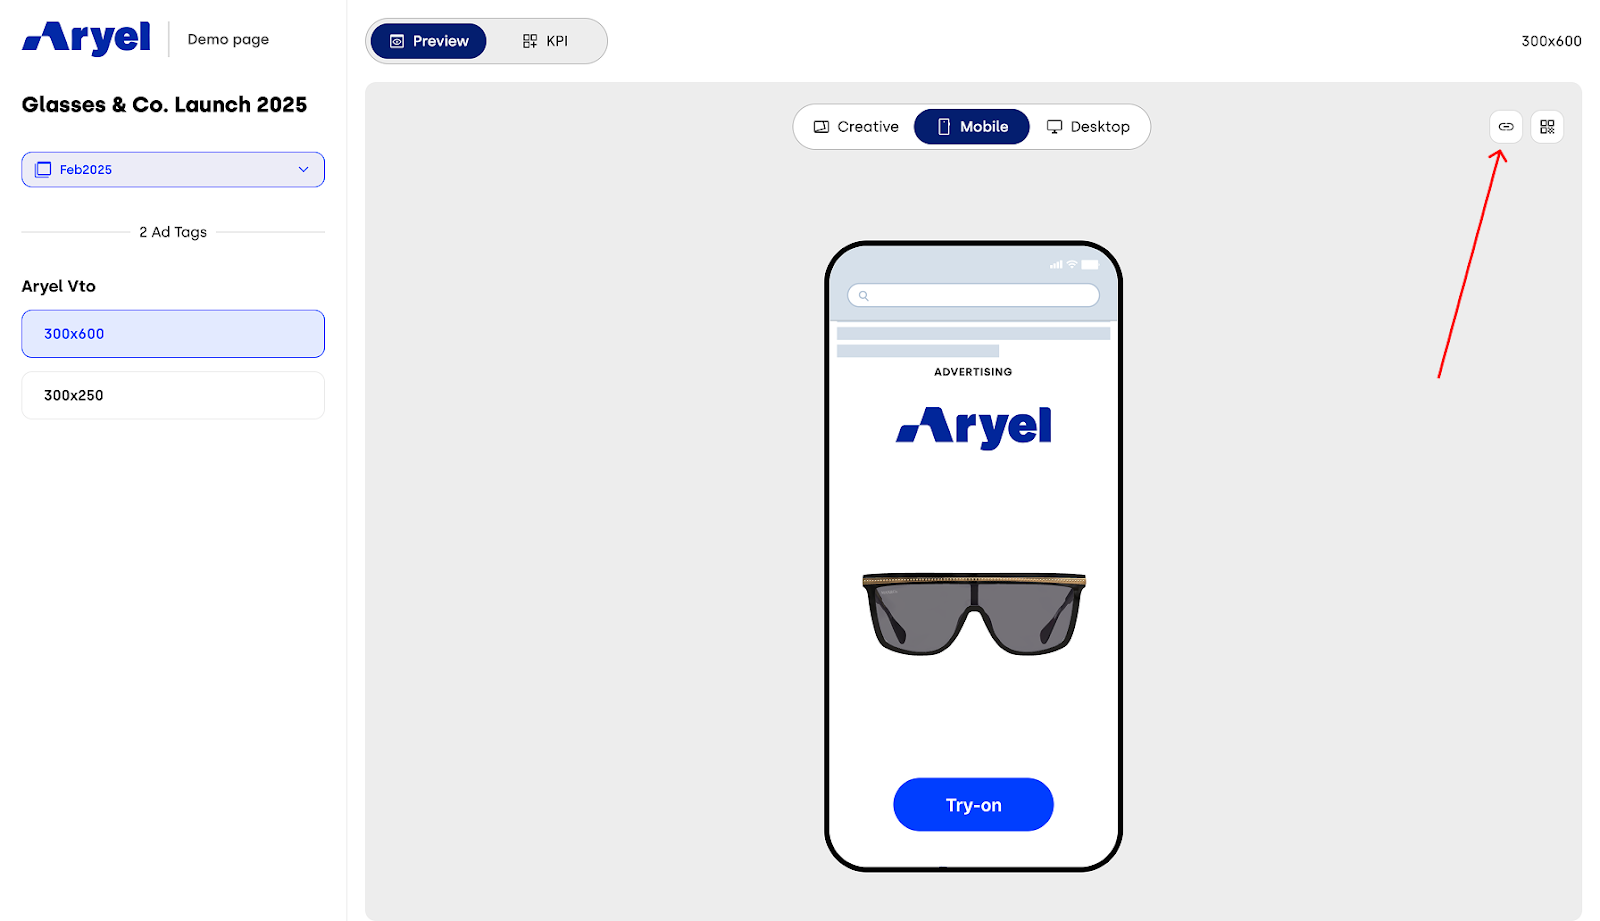
From the same environment, you can easily share what you are visualizing. The Tag Demo Page lets you generate a public link via the share icon, which can be sent to colleagues or stakeholders without requiring any login credentials, making the review process smoother.
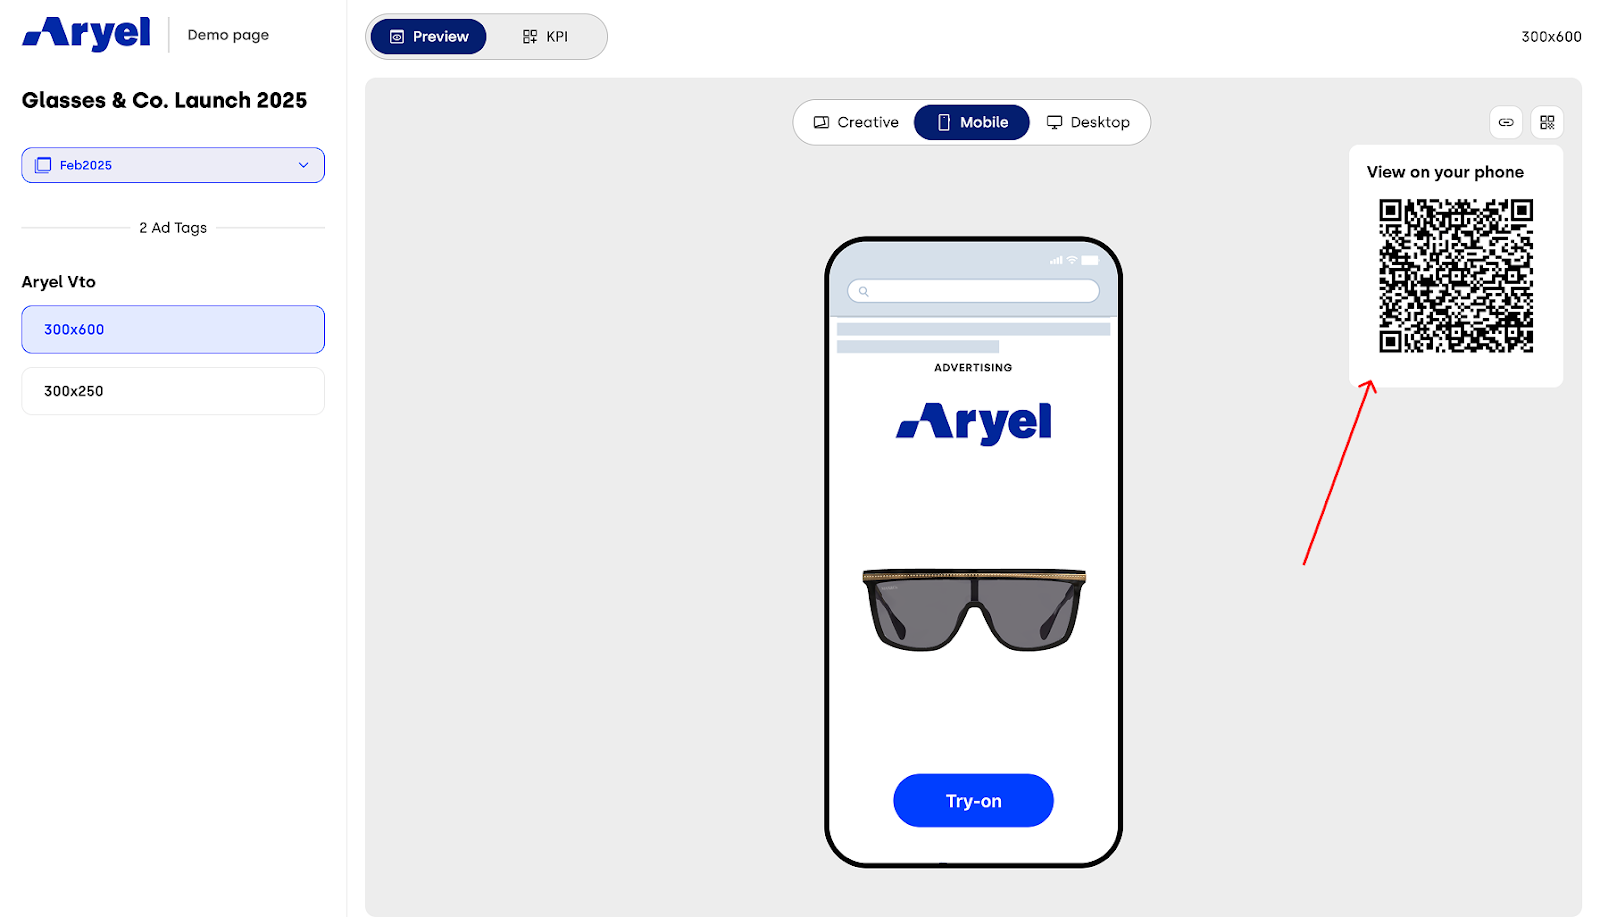
When you need to focus on mobile, you can generate a QR code instead: scanning it with a smartphone or tablet opens the mobile preview instantly, enabling fast and realistic testing on real devices.
2. KPI Section
The KPI section brings together all the key performance data of your campaign in a single view and is divided into two main areas that work together.
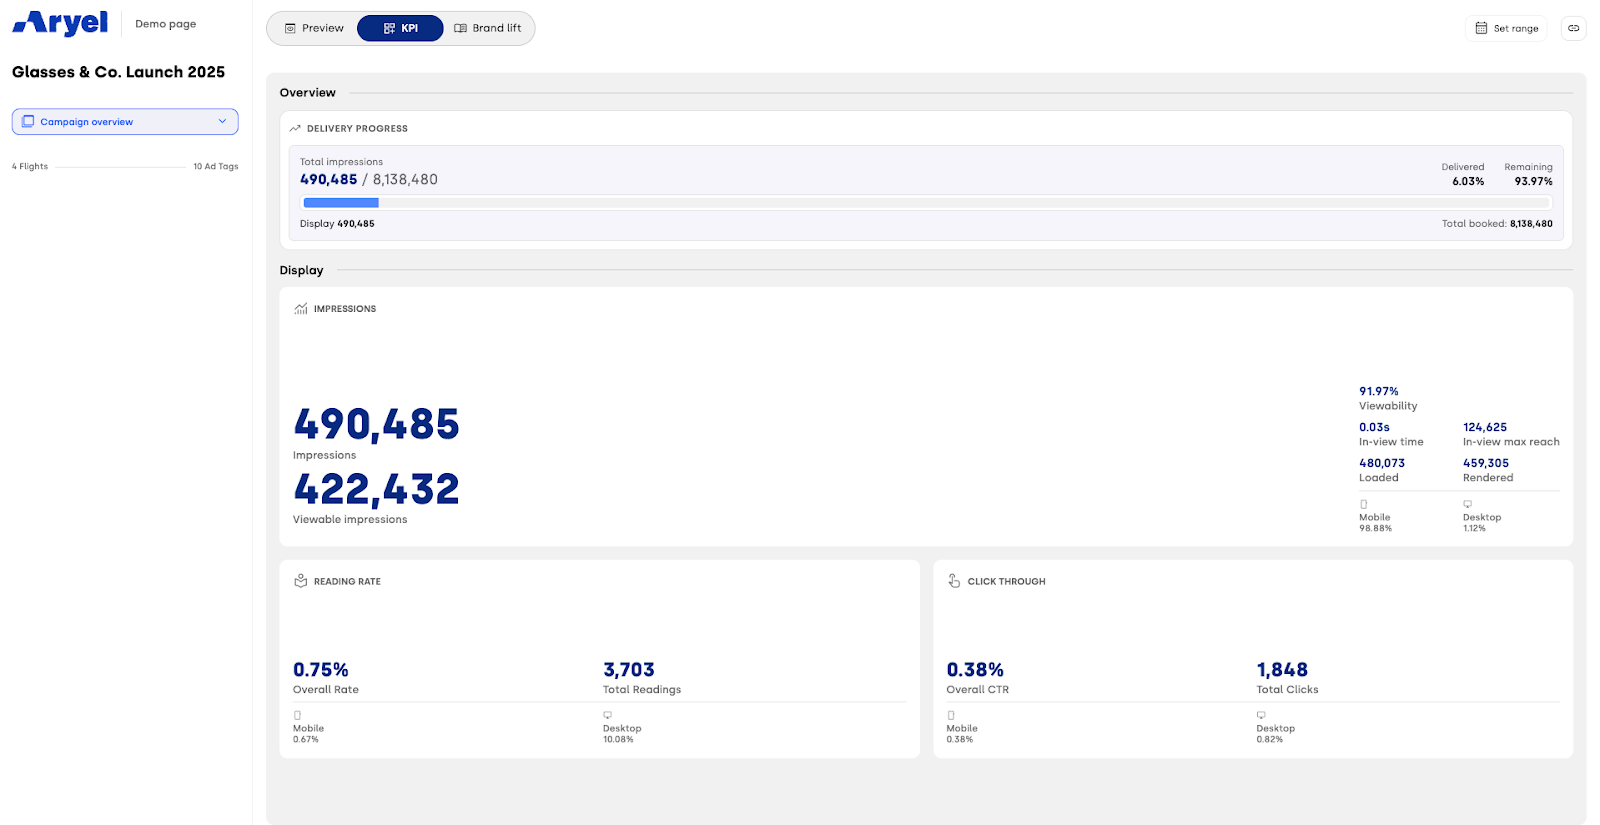
On the left, a simple dropdown menu allows you to display the overall campaign performance or the ones related to the single flights, where you can get access to a more granular level of KPI details.
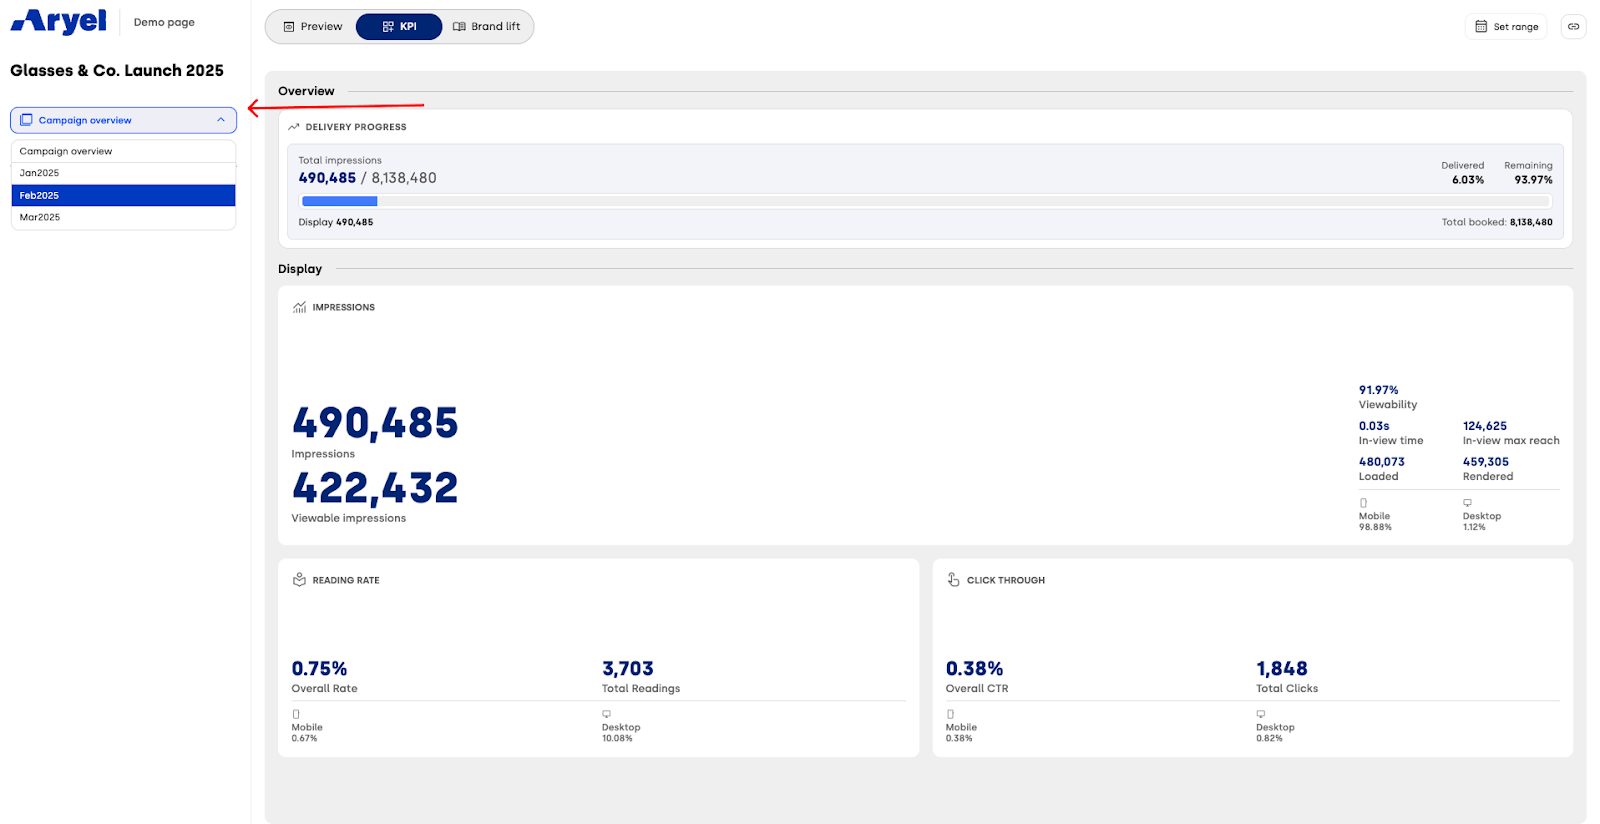
On the right side, you will find the KPI display area, which mirrors the KPI tab inside the Flight Detail Page in Ads Manager. At the top, the main metrics for the selected scope are presented clearly, but the way they are displayed can change based on the campaign’s key metric — impressions, reading, or click. Each key metric highlights a different set of insights, shaping how performance data is organized and interpreted within this section. For a full overview of the different key metrics and how they work, you can refer to the dedicated article.
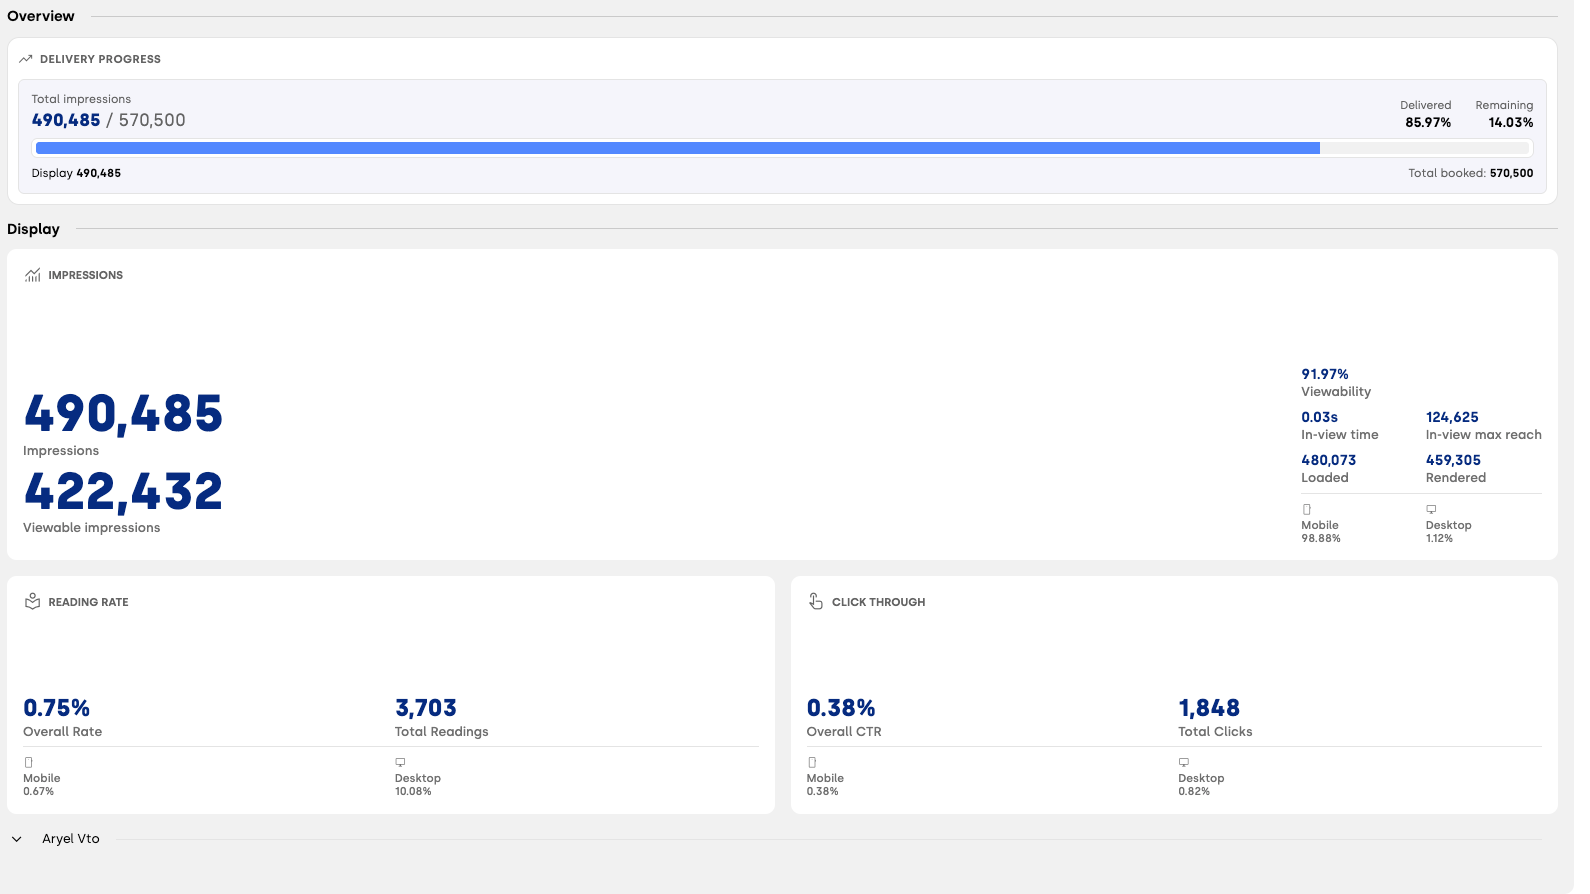
From there, you can progressively drill down from campaign-level data to the performance of each creative and, finally, to the single tag level, maintaining a consistent reading of the metrics across all steps.
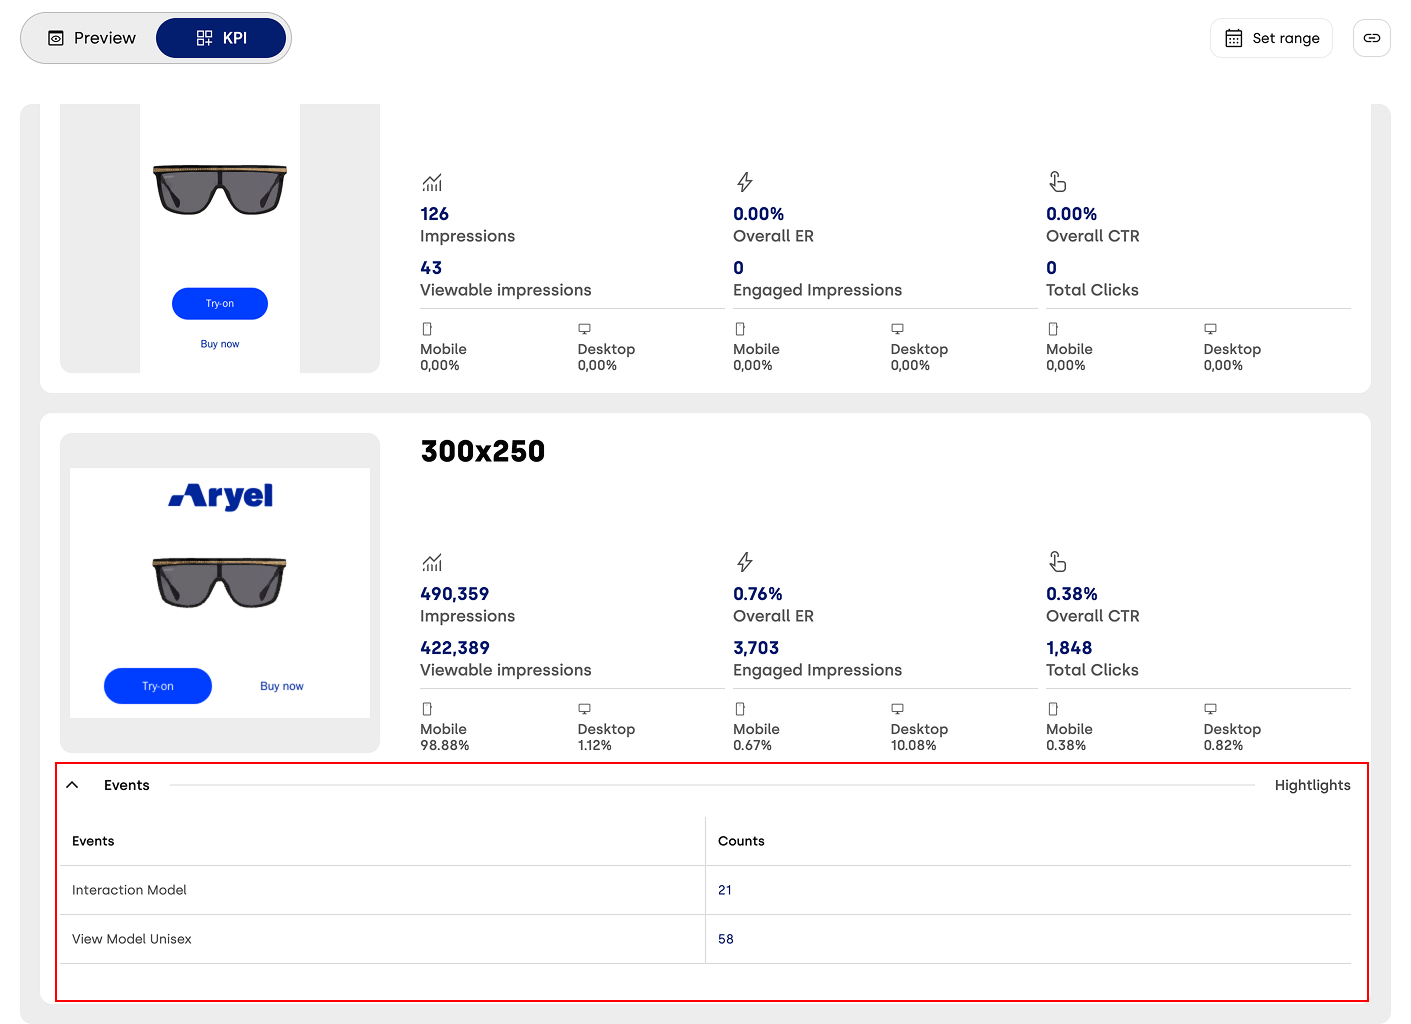
When you are analyzing data at tag level, clicking the arrow icon gives you access to the Events tab. This view shows all the custom events associated with that specific creative, helping you understand not only how many interactions occurred but also which specific behaviors users performed.
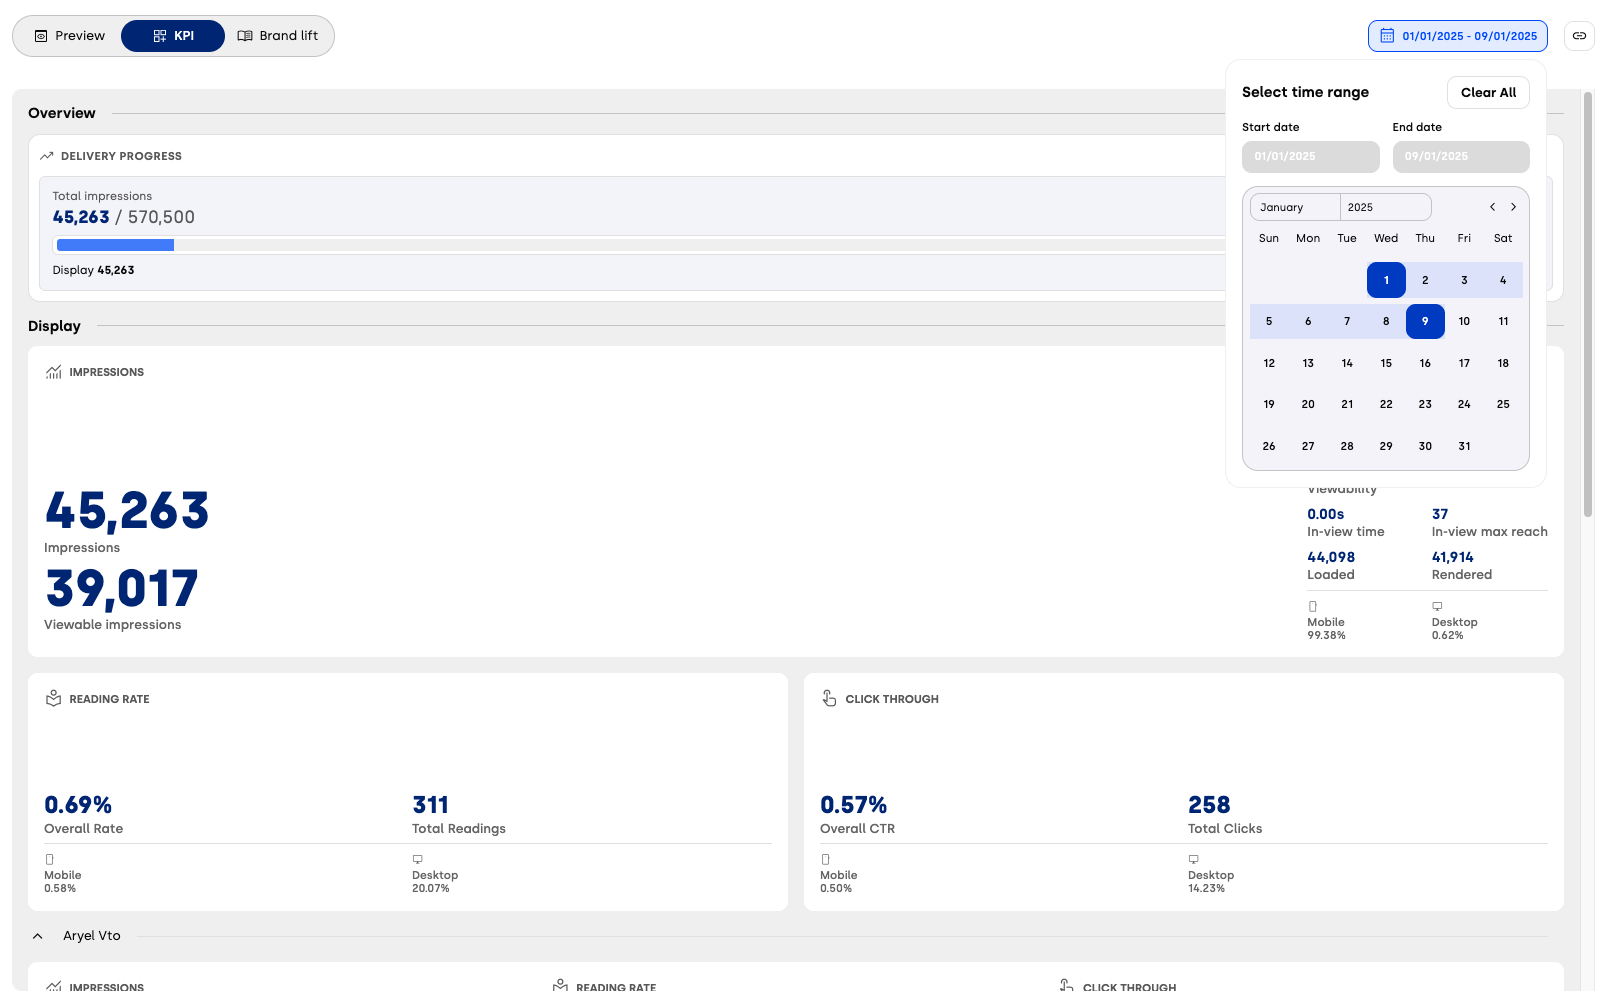
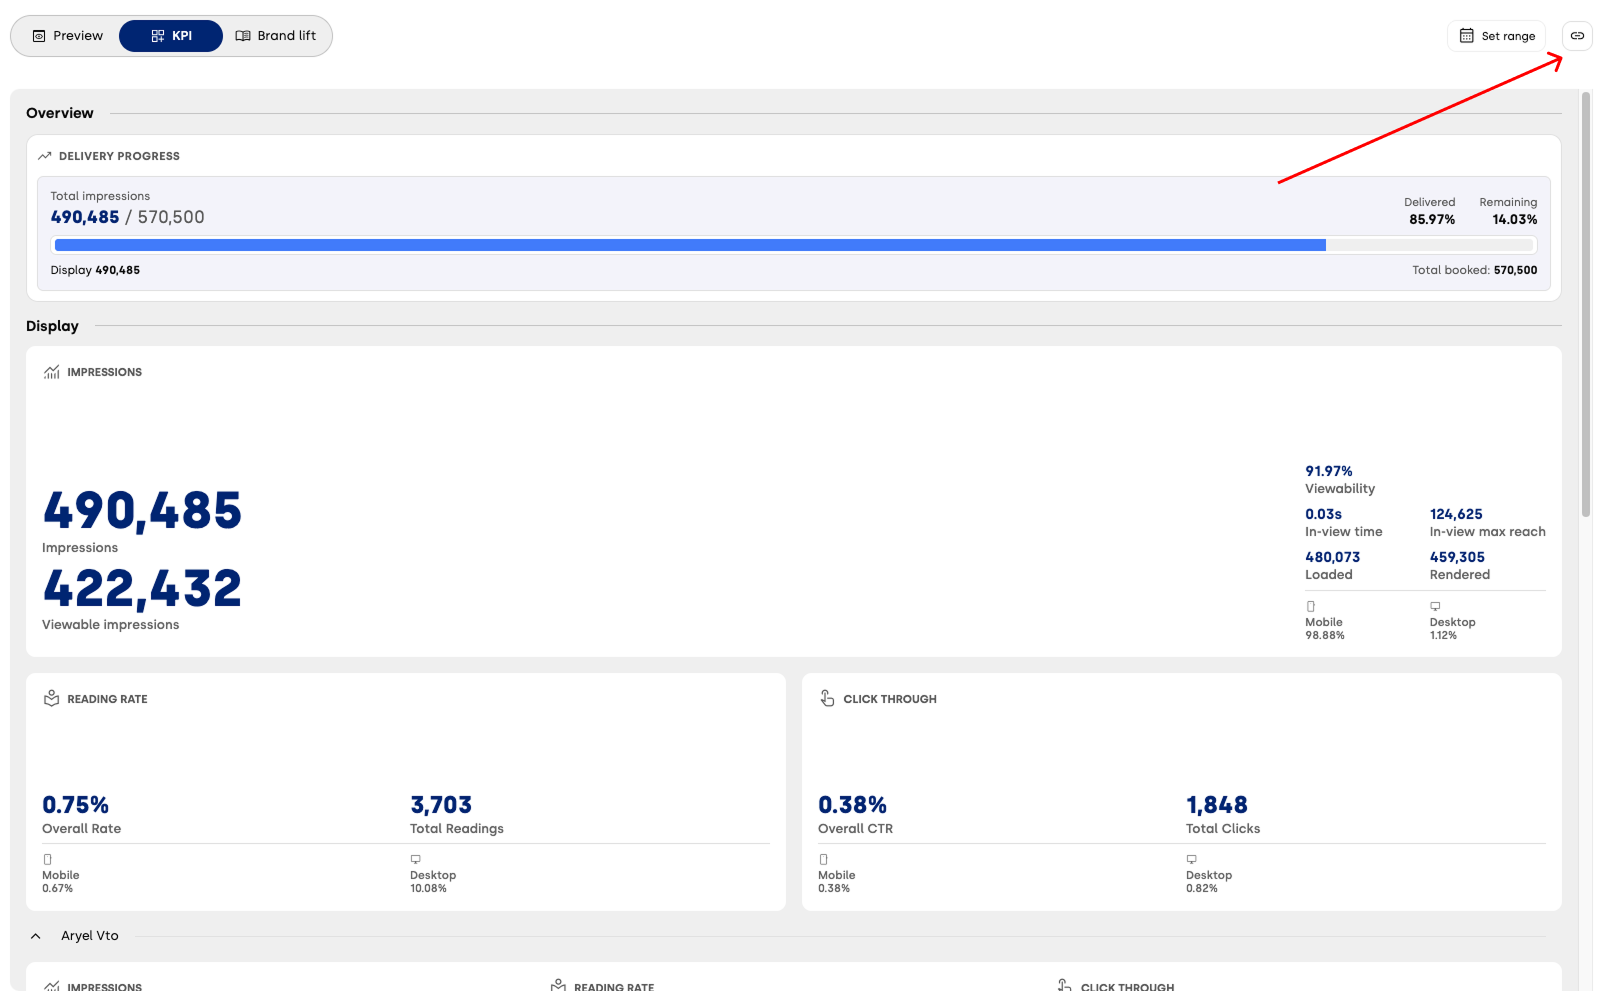
In the top-right corner of the KPI section, you can refine and share what you see.
The Set Range control lets you apply a custom time range to your KPIs so you can focus on a specific flight period.
Next to it, the copy link button allows you to generate a shareable URL for the current KPI view, which you can send to users who do not have direct access to Ads Manager but still need to visualize performance.
Why Use the Insights-Demo Page?
With the Insights-Demo Page, you can unify KPIs and creative previews in a single, streamlined environment — making it faster and easier to share campaign performance and assets with clients and collaborators.